Figures & data
Table 1 Pharmacokinetic profile of different formulations
Figure 1 Biodistribution study of (A) TQ solution (intravenous), (B) TQ solution (intranasal), and (C) chitosan nanoparticles encapsulating TQ (intranasal).
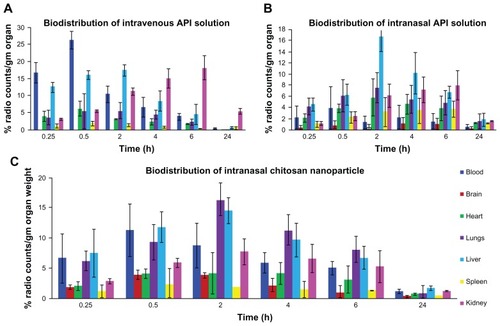
Table 2 Results showing effects of different concentration of CS and TPP
Table 3 Particle size and particle size distribution of placebo formulations
Figure 2 Chitosan nanoshell showing possible interaction between chitosan and thymoquinone.
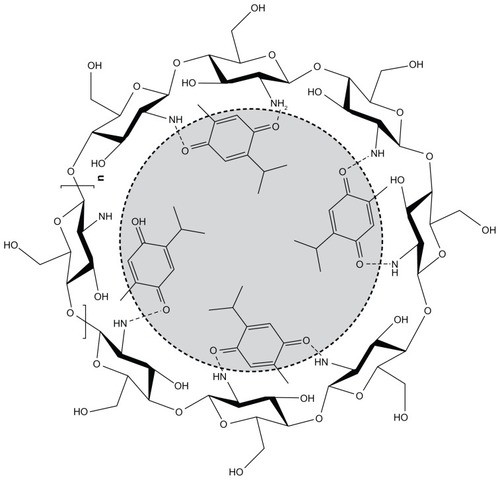
Figure 3 Dynamic light scattering technique for determining the particle size distribution of placebo nanoparticles (A and B) and TQ-encapsulated nanoparticles (C), and zeta potential of TQ-encapsulated nanoparticles (D).
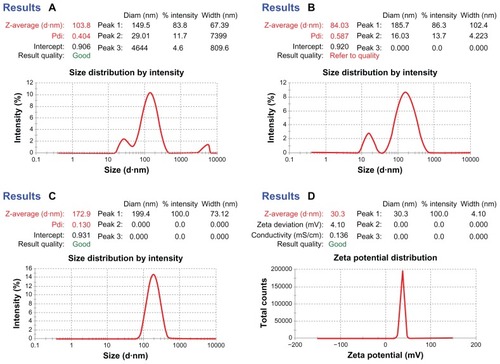
Table 4 Particle size and particle size distribution of drug-loaded formulation
Table 5 Effect of TQ concentration on EE and LC
Figure 4 Transmission electron (A) and scanning electron (B) microscopy study of optimized nanoparticles.
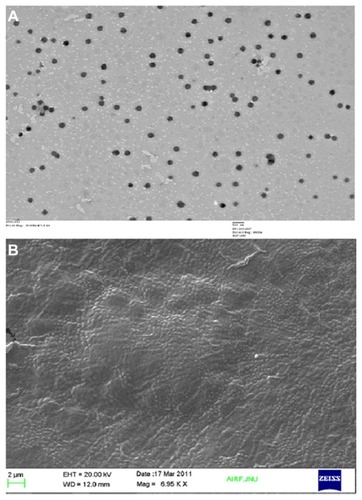
Figure 5 Differential scanning calorimetry (A) and X-ray diffraction spectroscopy (B) of thymoquinone (a), chitosan (b), physical mixture of thymoquinone–chitosan (c), and thymoquinone containing chitosan nanoparticles (d), respectively.
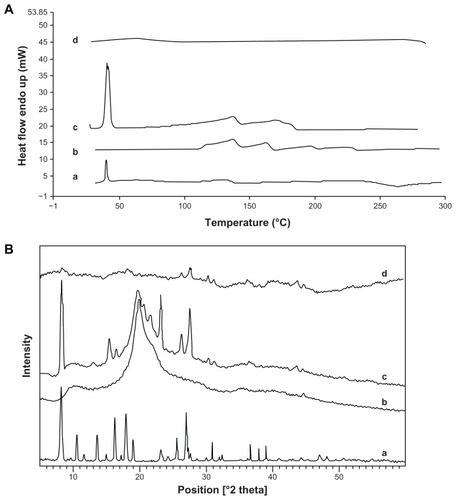
Table 6 Coefficient of correlation for optimized CS NPs
Figure 6 Ex vivo permeation of nanoparticles using porcine nasal mucosa.
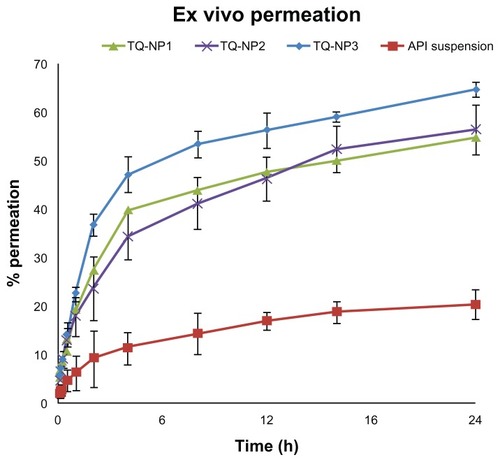
Table 7 In vitro radiolabeling stability in normal saline, rat plasma, and in rat brain homogenate
Table 8 Nose-to-brain drug-targeting parameters of different formulations
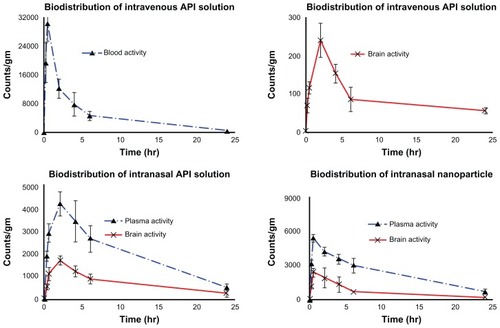
Figure 7 Concentration–time profile of thymoquinone (TQ) in plasma and brain after intravenous administration of TQ solution and intranasal administration of TQ solution and TQ nanoparticles, respectively (anti-clockwise).
Abbreviation: API, active pharmaceutical ingredient.