Figures & data
Scheme 1 Construction of CAT-Ce6@OMV-aPDL1 (A) and illustrations of promoted oxygenated PDT as well as activated anti-tumor immune responses induced by CAT-Ce6@OMV-aPDL1-based PDT and immunomodulation (B).
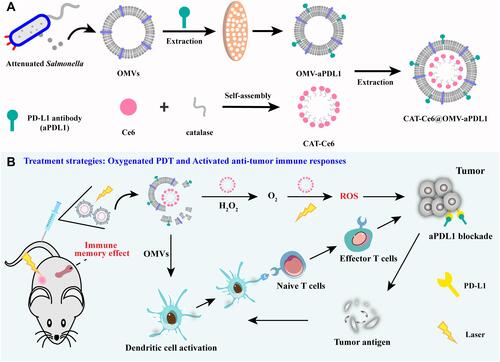
Figure 1 Characterization of CAT-Ce6@OMV-aPDL1. (A) The TEM images of CAT-Ce6, OMVs, CAT-Ce6@OMV-aPDL1. Scale bar, 100 nm. (B) Average sizes and zeta potentials of different agents: (1) CAT-Ce6, (2) OMVs, (3) CAT-Ce6@OMV-aPDL1. (C) Protein patterns of different agents: (1) marker, (2) catalase, (3) OMVs, (4) aPD-L1, (5) OMV-aPDL1, (6) CAT-Ce6@OMV-aPDL1. Encapsulation efficiency (D) and loading rate (E) of CAT-Ce6. (F) The stability of CAT-Ce6@OMV-aPDL1 in PBS and FBS (25 °C) solution during 7 days. (G) The release rate of CAT-Ce6 under laser irradiation or not. (H) The catalytic activity of catalase in CAT-Ce6. (I) The catalytic activity of catalase or CAT-Ce6, which was pretreated with protease K (0.4 mg mL−1) at different times. (J) O2 concentration of different formulations after incubating with H2O2 solution (H2O2= 1mM). (K) Time-dependent degradation of DPBF after incubating with different formulations under laser irradiation.
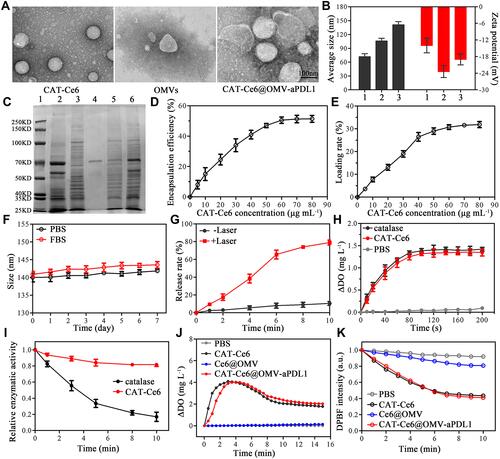
Figure 2 Biodistribution and long-term hypoxia relief of CAT-Ce6@OMV-aPDL1 in vivo. (A) The biodistribution of free Ce6, CAT-Ce6 and CAT-Ce6@OMV-aPDL1 over time. (B) Organs and tumor distribution of different formulations ex vivo at 24 h post-injection. (C) Tumor infiltration of different formulations at 24 h post-injection. Scale bar, 100 μm. (D) The hypoxia relief degree at 12, 24 h post laser irradiation of CAT-Ce6 or CAT-Ce6@OMV-aPDL1 group. Blue: DAPI, green: Alexa Fluor488-conjugated Hif-1α antibody. Scale bar, 100 μm. (E) Micrographs of five main organs measured by H&E staining after two intravenous injections of PBS, CAT-Ce6 or CAT-Ce6@OMV-aPDL1. Scale bar, 50 μm.
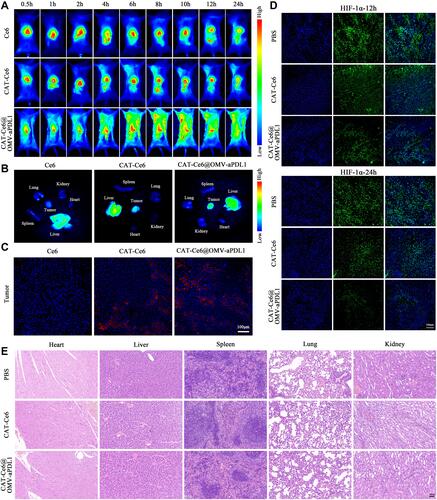
Figure 3 In vitro cell cytotoxicity and immune activation assay. Cell viability of 4T1 cells after incubated with PBS, CAT-Ce6, Ce6@OMV, CAT-Ce6@OMV, CAT-Ce6@OMV-aPDL1 without (A) or with (B) laser irradiation (660 nm, 0.15 W/cm2, 5 min). (C) Cell death rate of 4T1 cells after incubation with different formulations with laser irradiation. (D) ROS production of 4T1 cells after incubation with different formulations under laser irradiation. (E) Staining of SINFEKL/H-2Kb antibody to assess the surface presentation of antigen by DCs after incubated with different formulations. Data are presented as mean ± SD, statistical significance was analyzed by one-way ANOVA, ns = P ≥ 0.05, ***P < 0.001.
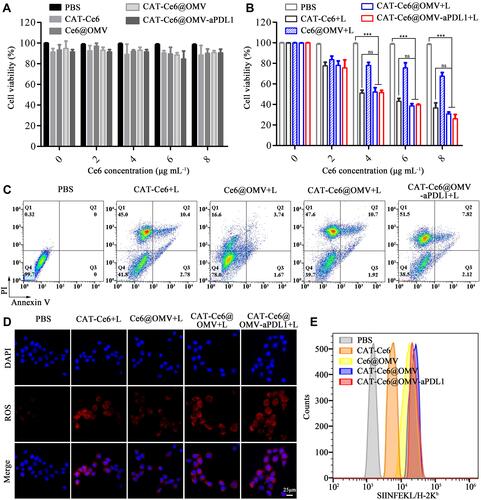
Figure 4 The anti-tumor effect of CAT-Ce6@OMV-aPDL1 under laser irradiation. (A) The diagrammatic sketch of CAT-Ce6@OMV-aPDL1 to suppress tumor growth in subcutaneous 4T1-tumor bearing model. The body weights (B) and tumor volumes (C) of the mice receiving different treatments. (D) Photographic images of tumors dissected from the mice receiving different treatments. (E) The survival rates of the mice receiving different treatments. TUNEL (F) and H&E (G) staining of tumor slices of mice receiving different treatments. Scale bar is 100 and 50 μm respectively. Data are presented as mean ± SD, statistical significance of (C) was analyzed by one-way ANOVA (compared with PBS group), and survival statistical significance was analyzed by log-rank (Mantel–Cox) test, *P < 0.05, **P < 0.01, ***P < 0.001.
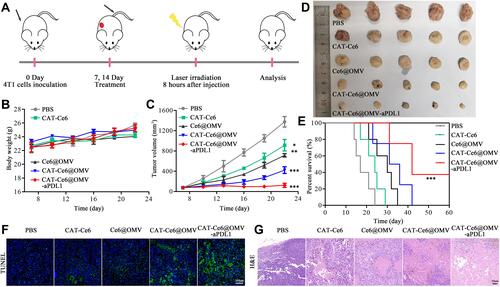
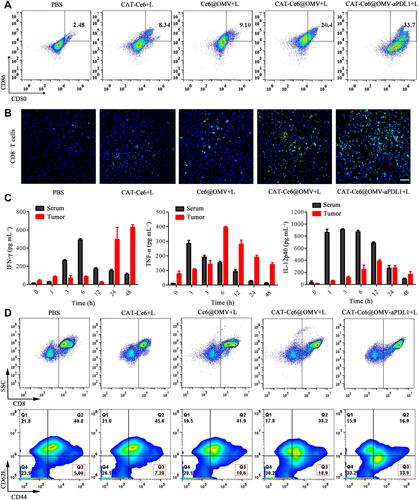
Figure 5 Investigation of immune responses in the 4T1-tumor bearing mice in vivo. (A) The percentage of mature DCs in the tumor tissues (gated on CD11c) 5 days after the last treatments. (B) The percentage of CD8+ T cells infiltrated in the tumor tissues 5 days after the last treatments. (C) The concentration of cytokines in serum and tumor tissues after single injection of CAT-Ce6@OMV-aPDL1 to 4T1-tumor bearing mice at different time points (n = 3). (D) The percentage of effector memory CD8+ T cells (CD44+CD62L−) in spleens 7 days after the last treatments.