Figures & data
Figure 1 (A and B) Indomethacin-loaded lipid-core nanocapsules (IndOH-LNCs) attenuate cell damage after exposure of organotypic hippocampal slices cultures to Aβ1-42 peptide. (A) Representative photomicrographs of propidium iodide (PI) uptake in hippocampal slices after 48 hour exposure to 2 μM Aβ1-42 and treated with 50 or 100 μM IndOH-LNCs, as described in “Materials and methods”; (B) quantification of PI uptake in response to Aβ peptide and IndOH-LNCs. Values are expressed as percentage of cell death in hippocampus.
Notes: #Significantly different from control cultures; ***significantly different from Aβ1-42 2 μM group. Two-way analysis of variance followed by Bonferroni post hoc test, P < 0.001. Bars represent the mean ± standard deviation, n = 12.
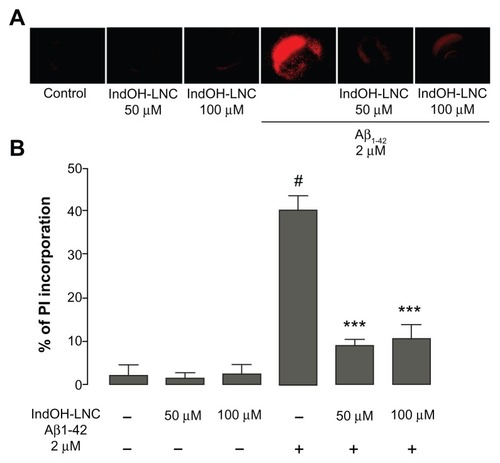
Figure 2 (A–C) Effects of indomethacin-loaded lipid-core nanocapsules (IndOH-LNCs) on the levels of cytokines in organotypic hippocampal cultures. (A) Tumor necrosis factor (TNF)-α, (B) interleukin (IL)-6, and (C) IL-10 levels in the culture medium after exposure of hippocampal cultures to Aβ1-42 for 48 hours and treatment with 50 or 100 μM IndOH-LNCs. IndOH-LNC treatment was administered simultaneously with the lesion and maintained during the recovery period for 48 hours.
Notes: #Significantly different from control cultures (P < 0.001); ***significantly different from Aβ1-42 2 μM group (P < 0.001). Two-way analysis of variance followed by Bonferroni post hoc test. Bars represent the mean ± standard deviation, n = 6.
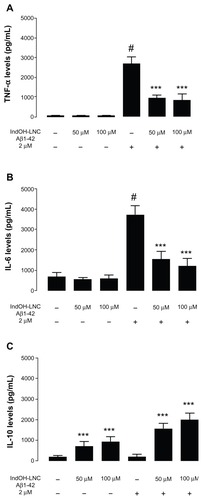
Figure 3 Effect of indomethacin (IndOH) and indomethacin-loaded lipid-core nanocapsules (IndOH-LNCs) on spontaneous alternation behavior. Rats were injected (2 nmol, icv) with Aβ1-42 or Aβ-vehicle and daily administered with IndOH or IndOH-LNC (1 mg/kg, ip), starting 1 day after Aβ1-42 injection, and maintained for 14 days. Spontaneous alternation behavior during 8 minute sessions in the Y-maze task was measured after 14 days of treatment.
Notes: *Significant differences between the indicated columns (P < 0.05). Two-way analysis of variance followed by Bonferroni post hoc test. Columns indicate mean ± standard deviation; n = 7–10 animals in each experimental group.
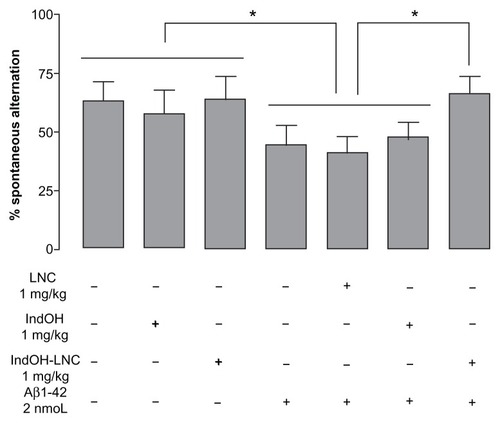
Figure 4 (A–C) Effect of indomethacin (IndOH) and indomethacin-loaded lipid-core nanocapsules (IndOH-LNCs) on novel object–recognition memory. Rats were injected (2 nmol, intracerebroventricularly) with Aβ1-42 or Aβ vehicle and administered daily with IndOH or IndOH-LNC s (1 mg/kg, intraperitoneally), starting 1 day after Aβ1-42 injection, and maintained for 14 days. Graphics show object-recognition index during 5 minutes in the training session (A), short-term-memory test session performed 3 hours after training (B), and long-term memory-test session performed 24 hours after training session (C).
Notes: **Significant differences between familiar and new object for each group (P < 0.01); ***significant differences between familiar and new object for each group (P < 0.001). Two-way analysis of variance followed by Bonferroni post hoc test. Columns indicate mean ± standard deviation; n = 7–10 animals in each experimental group.
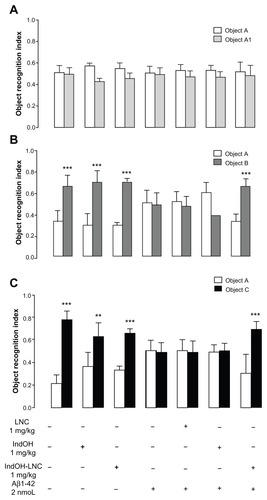
Figure 5 (A and B) Aβ1-42 injection causes synaptotoxicity, which is prevented by indomethacin-loaded lipid-core nanocapsule (IndOH-LNC) treatment. (A) Representative Western blotting analysis for synaptophysin and β-actin protein (loading control) was performed in the hippocampus of animals after injection with Aβ1-42 (2 nmol, intracerebroventricularly) and treated for 14 days with IndOH or IndOH-LNCs (1 mg/kg, intraperitoneally), starting 1 day after Aβ injection. (B) Graphic shows quantification of synaptophysin immunocontent normalized by β-actin protein (loading control).
Notes: #Significantly different from the respective control cultures (P < 0.01); **significantly different from Aβ1-42 2 μM and Aβ1-42 2 μM + LNC groups (P < 0.01). Two-way analysis of variance followed by Bonferroni post hoc test. The values represent synaptophysin levels, expressed as the average percentage increase (mean ± standard deviation) over basal levels; n = 7 animals in each experimental group.
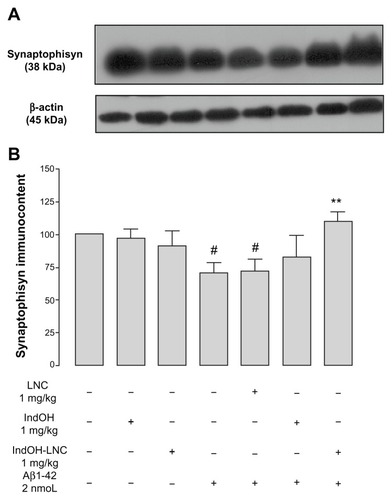
Figure 6 (A–D) Astrocytic activation induced by Aβ1-42 peptide can be reduced by indomethacin-loaded lipid-core nanocapsules (IndOH-LNCs). Representative Western blotting of glial fibrillary acidic protein (GFAP) immunoreactivity in (A) organotypic hippocampal cultures after 48 hours of exposure to Aβ1-42 and treatment with 50 or 100 μM IndOH-LNCs, and in (C) the hippocampus 15 days after intracerebroventricular injection of Aβ1-42 (2 nmol) and treatment with IndOH or IndOH-LNCs (1 mg/kg, intraperitoneally). Graphics show quantification of GFAP immunocontent normalized by β-actin protein (loading control). The values represent GFAP levels, expressed as the average percentage increase (mean ± standard deviation) over basal levels in (B) organotypic hippocampal cultures (n = 6) and (D) the hippocampus 15 days after intracerebroventricular injection of Aβ1-42 (n = 8).
Notes: #Significantly different from the respective control groups (P < 0.001); *significantly different from Aβ1-42 2 μM group (P < 0.05); ***significantly different from (B) Aβ1-42 2 μM group or (D) Aβ1-42 and Aβ1-42 treated with vehicle groups (P < 0.001). Two-way analysis of variance followed by Bonferroni post hoc test.
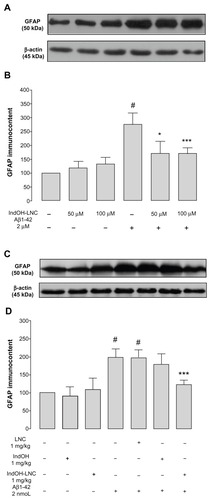
Figure 7 (A and B) Indomethacin-loaded lipid-core nanocapsule (IndOH-LNC) treatment reduces inducible nitric oxide synthase (iNOS) immunocontent in the hippocampus after icv injection of Aβ1-42. (A) Representative Western blotting of iNOS in the hippocampus 15 days after intracerebroventricular injection of Aβ1-42 (2 nmol) and treatment with IndOH or IndOH-LNCs (1 mg/kg, intraperitoneally). (B) Graphic shows quantification of iNOS immunocontent normalized by β-actin protein (loading control).
Notes: #Significantly different from all control groups (P < 0.05); *significantly different from Aβ1-42 and Aβ1-42 treated with vehicle groups (P < 0.05). The values represent iNOS levels, expressed as the average percentage increase (mean ± standard deviation) over basal levels; n = 5–8 animals in each experimental group. Two-way analysis of variance followed by Bonferroni post hoc test.
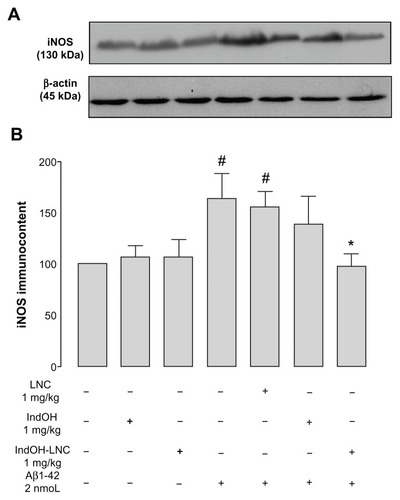
Figure 8 Indomethacin-loaded lipid-core nanocapsule (IndOH-LNC) treatment reduces microglial activation in the hippocampus after intracerebroventricular injection of Aβ1-42. Representative image showing isolectin B4 (IB4) reactivity (120 kDa) in the hippocampus 15 days after intracerebroventricular injection of Aβ1-42 (2 nmol) and treatment with IndOH or IndOH-LNCs (1 mg/kg, intraperitoneally).
Note: The images are representative of n = 6 animals in each experimental group.
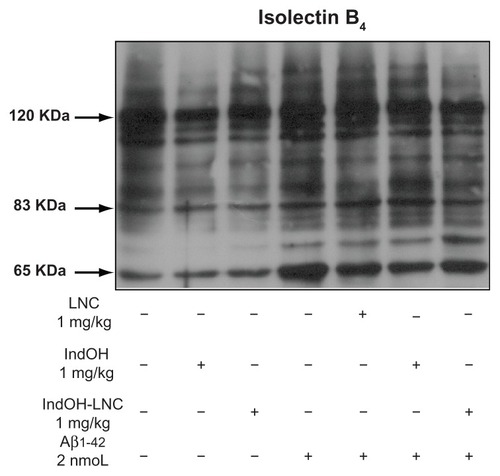
Figure 9 (A–D) C-jun N-terminal kinase (JNK) phosphorylation induced by Aβ1-42 peptide can be reduced by indomethacin-loaded lipid-core nanocapsules (IndOH-LNCs). Representative Western blotting of phosphorylated JNK (pJNK), JNK, and β-actin immunocontent in (A) organotypic hippocampal cultures after 48 hours of exposure to Aβ1-42 and treatment with 50 or 100 μM IndOH-LNCs, and in (C) the hippocampus of animals after being injected with Aβ1- 42 (2 nmol, intracerebroventricularly) and treated by 14 days with IndOH or IndOH-LNCs (1 mg/kg, intraperitoneally). Histogram represents the quantitative Western blotting analysis of JNK phosphorylation state. The densitometric values obtained to phospho- and total JNK from treatments were normalized to their respective controls nonexposed to Aβ1-42 toxicity condition (control bar; 100%). Data are expressed as a ratio of the normalized percentages of pJNK and JNK. Bars represent the mean ± standard deviation for (B) organotypic hippocampal cultures (n = 6) and (D) hippocampus of animals after injection with Aβ1-42 (n = 7).
Notes: #Significantly different from the respective control groups (P < 0.001); ***significantly different from (B) Aβ1-42 2-μM group or (D) Aβ1-42 and Aβ1-42 treated with vehicles groups (P < 0.001). Two-way analysis of variance followed by Bonferroni post hoc test.
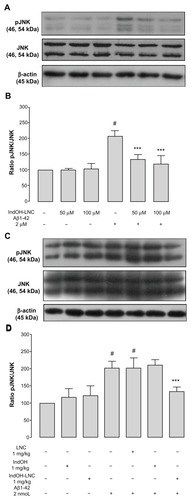
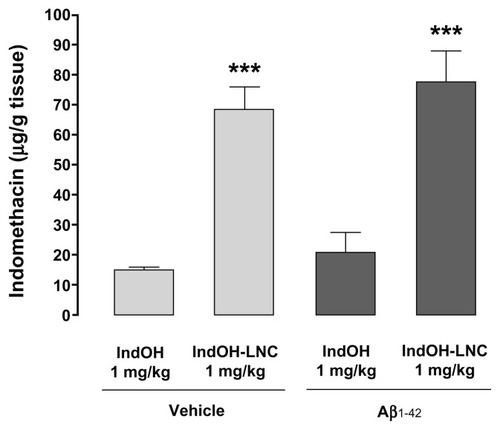
Figure 10 Lipid-core nanocapsules (LNCs) improve the brain biodistribution of indomethacin (IndOH). Brain amount of IndOH was analyzed by high-performance liquid chromatography in rats injected (2 nmol, intracerebroventricularly) with Aβ1-42 or Aβ vehicle and administered daily with IndOH or IndOH-LNCs (1 mg/kg, intraperitoneally) for 14 days, as described in “Materials and methods.”
Notes: ***Significantly different between IndOH-LNC group and the respective IndOH group (P < 0.001). Bars represent the mean ± standard deviation, n = 8. Two-way analysis of variance followed by Bonferroni post hoc test.