
Figures & data
Table 1 Chemical Composition of Some Bio-Sources Ash
Figure 1 Effects of pH value on the silica condensation rate, charge properties and charge density on the surface of the silica species.
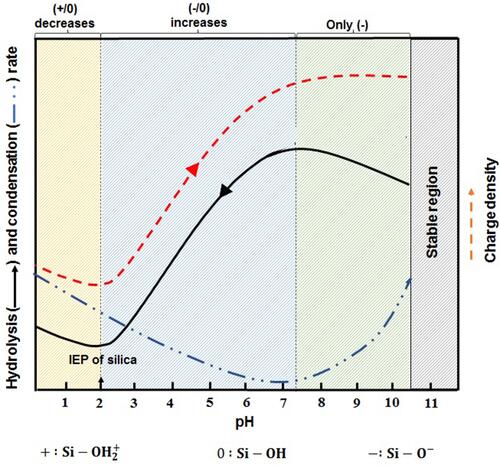
Table 2 Composition of RHA Derived from Calcination of Rice Husk at 600 °C for 12 h
Table 3 Several Biogenic Silica Nanoparticles and Their Applications
Table 4 Chemical Composition Analyzed by XRF, Loss on Ignition, and Total Carbon of Three RHA Types (Wt%)
Figure 2 (A) The overall procedure of mesoporous silica nanoparticles synthesis from rice husk and (B) nanoparticles surface modification synthesis by DBD plasma modification with i) Direct and ii) direct hybrid modes to pH and Temperature-responsive drug delivery system synthesis.
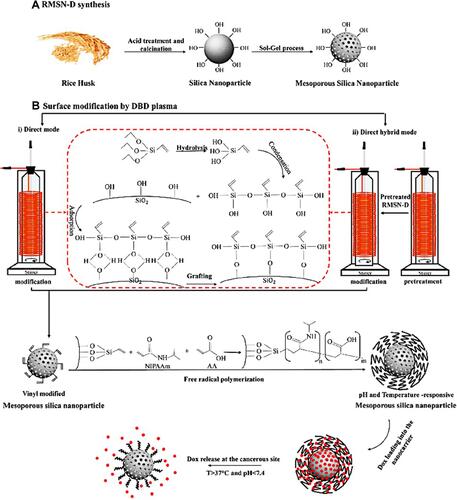
Figure 3 Stimuli-responsive drug delivery systems based on MSNs. Created with BioRender.com.
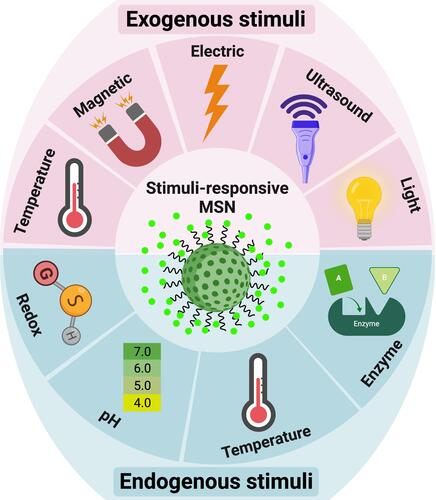
Figure 4 Active targeting strategies based on MSNs. Created with BioRender.com.
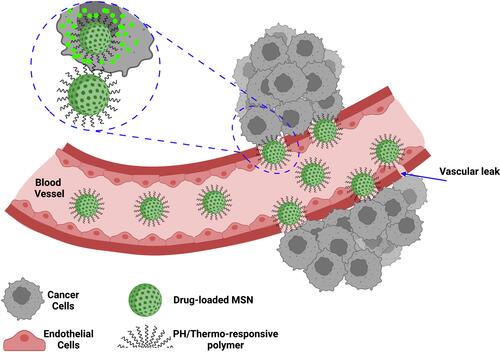
Figure 5 CLSM images of MSNs-TAT with diameters of (A) 25, (B) 50, (C) 67, and (D) 105 nm after incubation with Hela cells for (i) 4, (ii) 8, and (iii) 24 h. Scale bars: 5 μm.
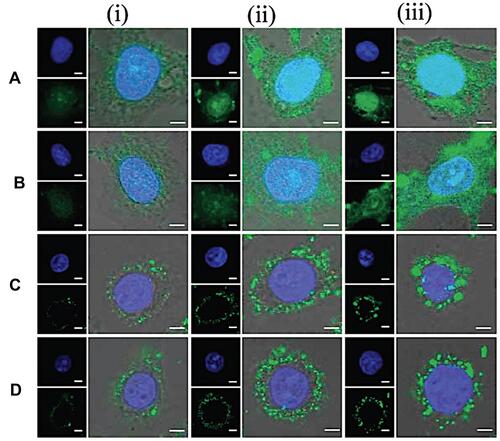
Figure 6 (A) Schematic illustration of MSN-BM/CD-HApt@DOX synthesis process and (B) the mechanism of targeting and cancer cells apoptosis.
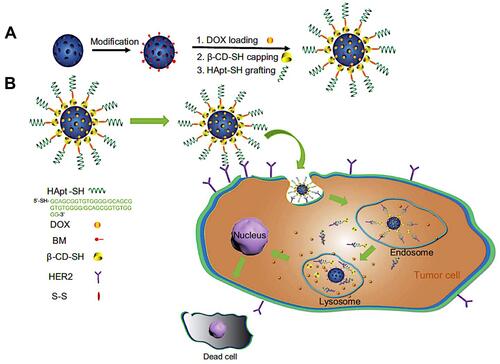
Figure 7 Schematic illustration of magnetic MSNs drug delivery systems preparation based on targeted and photothermal cancer therapy strategies.
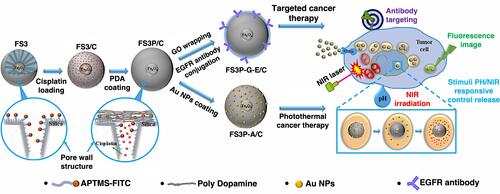
Table 5 Some Examples of Drug Delivery Systems Based on MSNs