Figures & data
Figure 1 X-ray diffraction spectra of ZnO, CuO, and Fe2O3 nanoparticles.
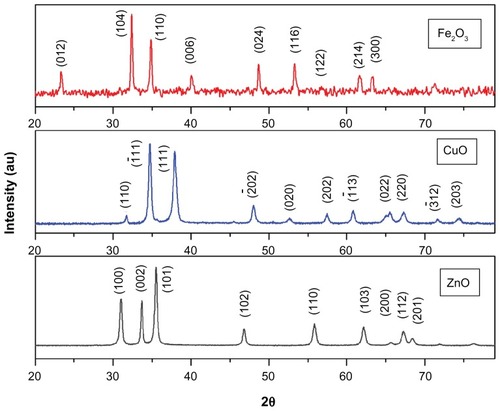
Figure 2 Transmission electron microscopy images of (A) ZnO, (B) CuO, and (C) Fe2O3 nanoparticles and histogram of particle-size distribution for different metal oxide nanoparticles.
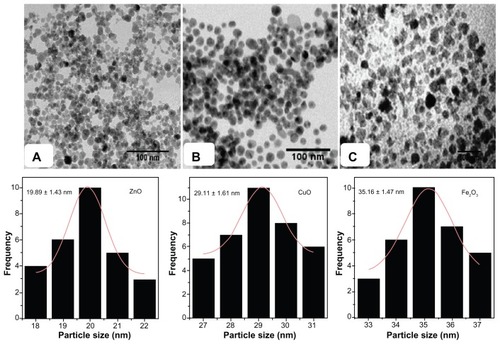
Figure 3 Fourier-transform infrared spectra of ZnO, CuO, and Fe2O3 nanoparticles.
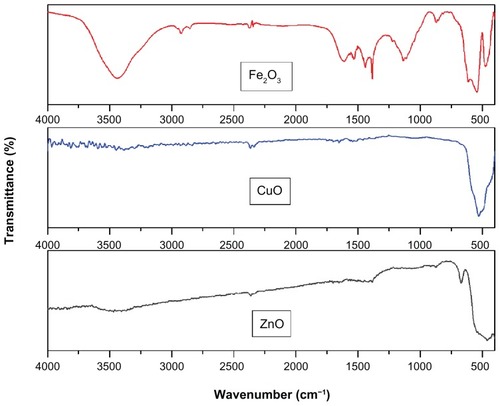
Figure 4 Zone of inhibition produced by different metal oxide nanoparticles against both Gram-positive and Gram-negative bacterial strains. Antibacterial activity of (A) ZnO; (B) CuO; and (C) Fe2O3 of bacterial strains (a), Escherichia coli, (b) Staphylococcus aureus, (c) Pseudomonas aeruginosa, and (d) Bacillus subtilis.
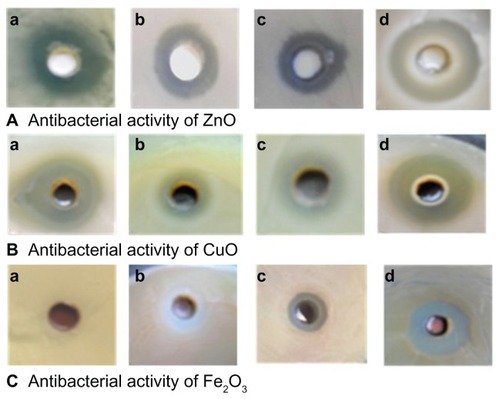
Figure 5 Bar graphs showing zone of inhibition introduced by different metal oxides against various microorganisms.
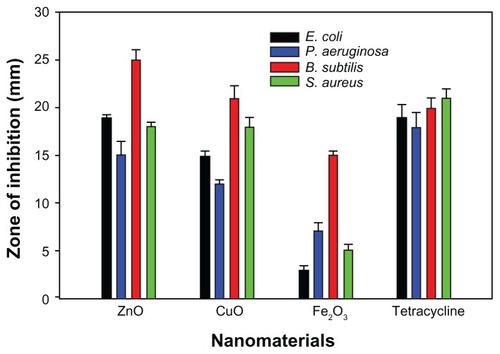
Table 1 Minimum bactericidal concentration (MBC) of different metal oxide nanoparticles against Gram-negative and Gram-positive bacteria