Figures & data
Figure 1 Synthesis and characterization of HCPT@NMOFs-RGD. (A) Scheme for the synthesis of HCPT@NMOFs-RGD nanocomposites. (B) TEM image of NMOFs. (C) View of NMOFs with uniform triangular 1D channels observed in the structure. (D) TEM images of NMOFs-RGD. Note that the RGD layer is distributed around the NMOFs at a thickness of 15 nm. (E) Fluorescence spectra (excitation at 530 nm) of NMOFs-RGD aqueous solution. (F) Absorbance spectra of ABDA in the presence of NMOFs-RGD over different periods under laser irradiation at 655 nm. (G) HCPT release performance of HCPT@NMOFs-RGD nanocomposites in PBS. Scale bar in (B): 0.2 μm; (D): 100 nm.
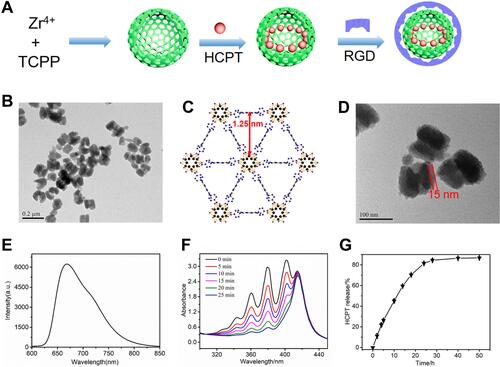
Figure 2 In vitro fluorescence imaging and cytotoxicity of NMOFs-RGD. (A) Fluorescence images of HepG2 cells exposed to NMOFs-RGD. Red signals are from NMOFs-RGD. Note that NMOFs-RGD are localized at the membrane and in the cytoplasm. (B) Statistical analysis of fluorescence intensity in NMOFs-RGD-incubated cells (Student’s t-test; *P<0.05, **P<0.01). (C) Statistical analysis of cell viability in HepG2 cells incubated with NMOFs (control) and NMOFs-RGD. Scale bar in (A): 20 μm.
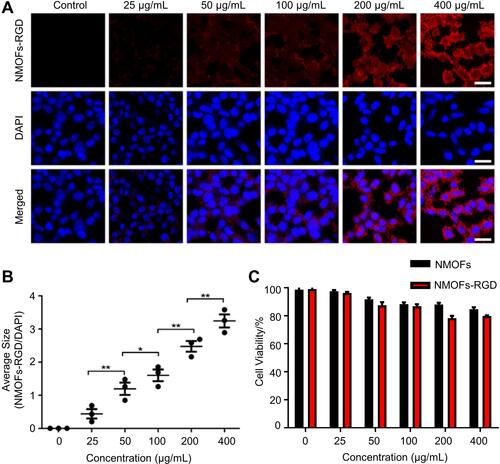
Figure 3 Time-lapse distribution of NMOFs-RGD in zebrafish larvae. (A) Fluorescence and (B) bright field images of NMOFs-RGD-exposed larvae at different hours post exposure (hpe). Red fluorescence was emitted by NMOFs-RGD. (C) Merged images from (A and B). Scale bar: 100 μm.
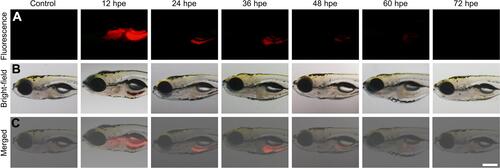
Figure 4 Targeted delivery of NMOFs-RGD to tumor tissue in HCC-bearing zebrafish. (A) The expression of integrin αvβ3. Red fluorescent signals are from integrin αvβ3-expressing cells. (B) The distribution of NMOFs-RGD in the liver of HCC krasG12V zebrafish. Red fluorescent signals are from NMOFs-RGD. Scale bar: 20 μm.
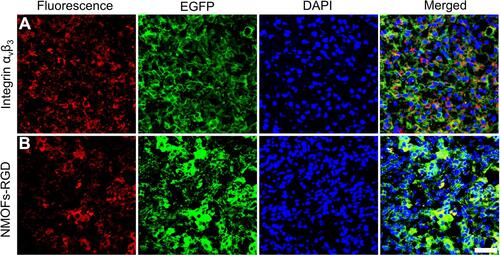
Figure 5 Time-lapse distribution of NMOFs-RGD in tumor-bearing mice. (A) Thermal images of NMOFs-RGD in control and tumor-bearing mice at 0, 1, 6, 12, and 24 hours (h) postinjection. (B) Thermal images of NMOFs-RGD in different organs of tumor-bearing mice: (a) tumor, (b) spleen, (c) liver, (d) intestine, (e) heart, (f) stomach, (g) kidney, and (k) lung.
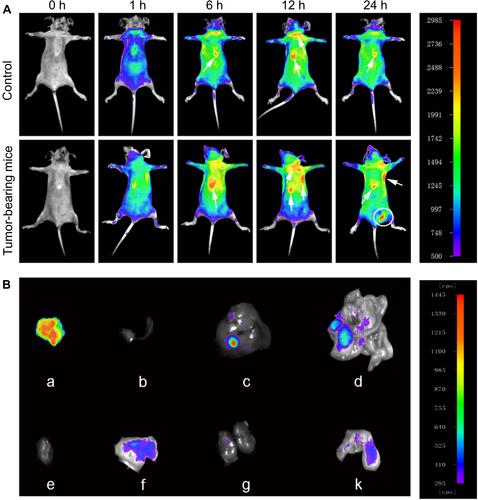
Figure 6 The chemotherapeutic effect of HCPT@NMOFs-RGD in HCC-bearing zebrafish. (A) Thermal imaging, (B) bright field, and (C) EGFP fluorescence of HCC-bearing zebrafish following HCPT@NMOFs-RGD treatment at 0 (control), 24, 48, 72, and 96 hours post treatment (hpt). (D) Statistical analysis of the intensity of thermal imaging (n=3 at each time point; ANOVA, *P<0.05, **P<0.01, ***P<0.001). (E) Statistical analysis of the intensity of EGFP-positive areas (n=3 at each time point; ANOVA, *P<0.05, **P<0.01, ***P<0.001). Scale bar in (B and C): 200 μm.
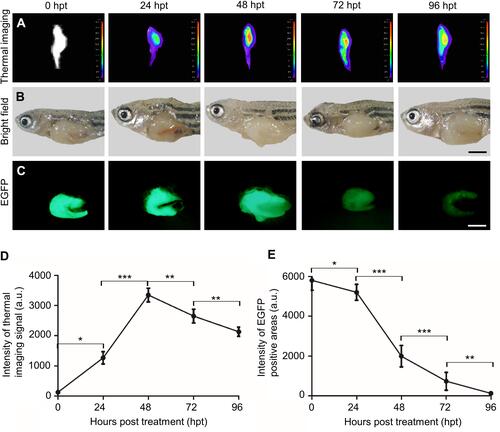
Figure 7 Time-lapse appearance of livers in HCC-bearing zebrafish following HCPT@NMOFs-RGD treatment. (A) Images of HCPT@NMOFs-RGD distribution in livers at 0 (control), 24, 48, 72, and 96 hours post treatment (hpt). (B) Images of EGFP fluorescence. (C) DAPI staining. (D) Merged images of (A–C). Scale bar: 20 μm.
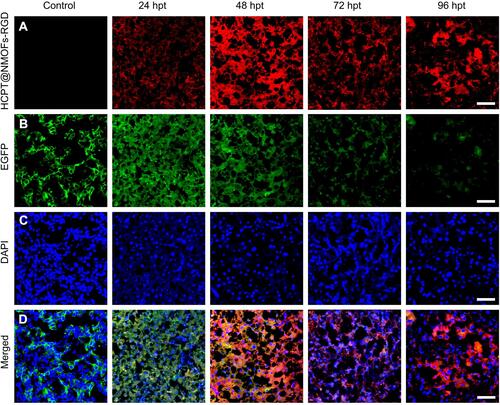
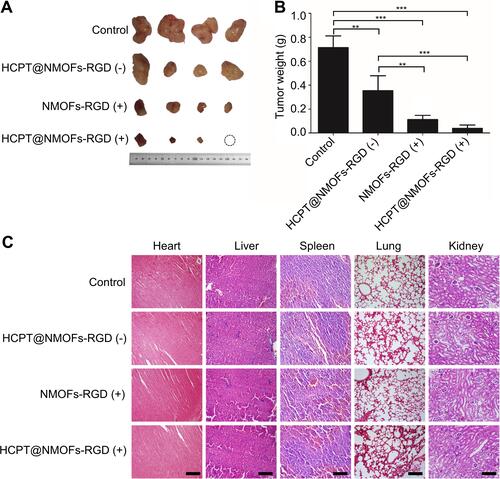
Figure 8 The reduction of tumors in HCC-bearing mice following chemo-, photodynamic-, and synergistic therapy. (A) Images of tumors following different treatments at 12 days post treatment (dpt). Note that one tumor in the HCPT@NMOFs-RGD (+) group completely disappeared. (B) Statistical analysis of tumor weight at 12 dpt (ANOVA; **P<0.01, ***P<0.001). (C) Images of HE staining of the heart, liver, spleen, lung and kidney. “(+)” and “(−)” represent samples with or without laser irradiation at 655 nm, respectively. Scale bar in (C): 50 μm.