Figures & data
Figure 1 Overview of biofabrication strategy to create a novel patient-specific meniscal scaffold based on bioprinting of cell-laden type 1 collagen hydrogel reinforced by multilayers of biomimetically aligned electrospun PCL/CNT nanofibers.
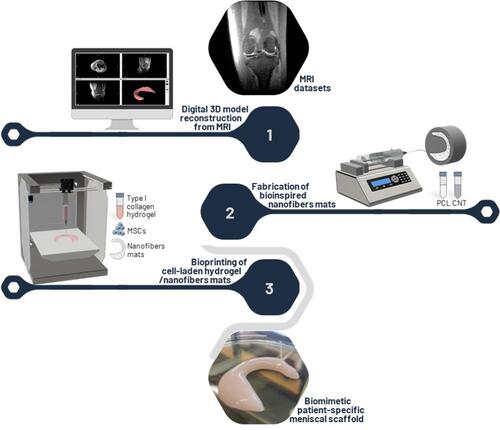
Table 1 Electrospinning Process Parameters of Aligned Nanofibrous Mats
Figure 2 (A) SEM image of electrospun PCL/CNT nanofibers aligned in different orientations, circumferentially (average fibers diameter 368 ± 84 nm) and radially (average fibers diameter 193 ± 68 nm) using previously designed electrospinning process. (B) Macroscopic appearance of biomimetic nanofibrous mats cut into cylindrical samples. (C) Side view of the hydrogel:nanofiber sample illustrating the nanofiber mats between the printed hydrogel layers.
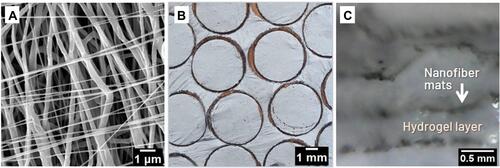
Figure 3 Morphological characterization of printed type 1 collagen hydrogel incorporated with different amounts of PCL/CNT nanofibrous mats. (A) Schematic illustration of printed hydrogel with varying ratios of nanofiber layers and top view of scaffolds shape before and after the crosslinking process (scale bar: 4 mm). (B) Quantitative analysis of shape fidelity immediately after the printing process (percentage values represent the relative increase in the cross-sectional surface area compared to the digital model). (C) Shrinkage test before and after the hydrogel crosslinking process (***p < 0.001).
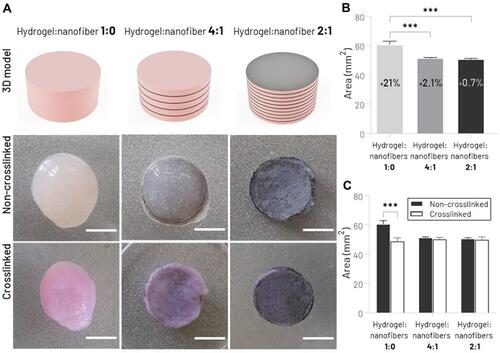
Figure 4 Mechanical assessment of hydrogel:nanofibers scaffolds. (A) Unconfined Compression Testing System. (B) Stress−strain curve. (C) Compressive Young’s modulus (*p < 0.05, **p < 0.01, ***p < 0.001).
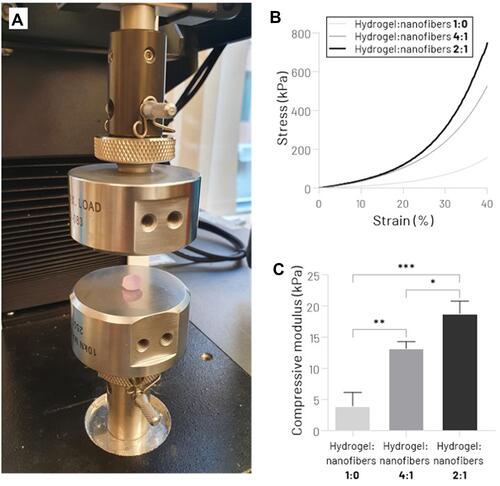
Figure 5 Cell viability analysis by live/dead assay. (A) Fluorescent microscopy images of live/dead staining of MSCs seeded on the different hydrogels:nanofibers groups, 1 and 7 days after the scaffolds biofabrication process (the green color indicates live cells, and the red color indicates dead cells) (scale bar: 100 μm). (B) Percentage cell viability after 1 and 7 days in cell culture. (C) Percentage cell viability after 7 days in cell culture comparing outer edge (external) and central region (internal) (*p < 0.05, **p < 0.01).
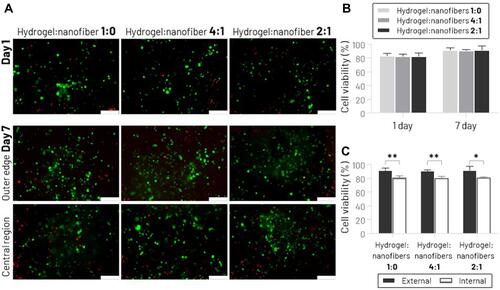
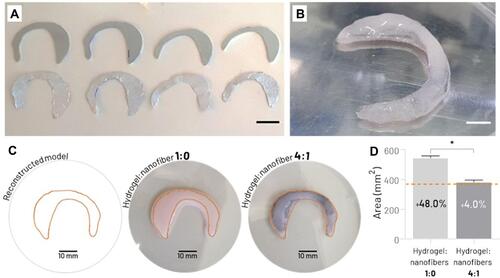
Figure 6 Design of patient-specific 3D digital model of the human knee meniscus. Illustration of medial meniscus segmentation from MRI images of the 3 distinct planes (A) axial plane; (B) Sagittal plane; and (C) Coronal plane) the right knee of a subject. (D) The reconstructed 3D digital model of the medial meniscus.
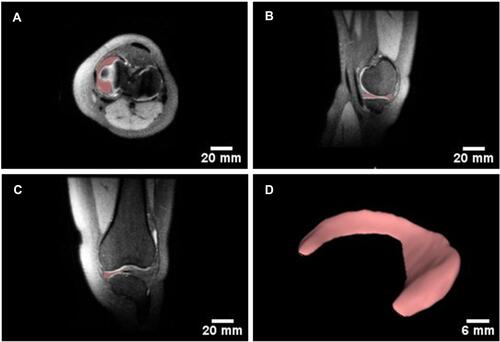
Figure 7 (A) Metal sheets used as electrospinning system collector (top row) for fabrication of the biomimetically aligned electrospun nanofibrous mats with custom dimensions (bottom row) (scale bar: 15 mm). (B) Photograph of a patient-specific bioprinted meniscal scaffold (hydrogel:nanofiber 4:1) (scale bar: 5 mm). (C) Top view of bioprinted meniscal scaffold based on nanofiber-free collagen hydrogel (hydrogel:nanofiber 1:0) and reinforced with biomimetic nanofibrous layers (hydrogel:nanofiber 4:1); compared to the reconstructed digital model (Orange line). (D) Quantitative analysis of shape fidelity of 2D area of the top of the bioprinted meniscal scaffolds (percentage values represent the relative increase in the cross-sectional surface area compared to the digital model) (the Orange dashed line represents the cross-sectional surface area of the digital template) (*p < 0.05).