Figures & data
Figure 1 Effects of different quantities of EVs derived from oviduct fluid on embryonic development ratio, pH, MDA and ammonium ion levels. (A) EV particles imaged using transmission electron microscopy (TEM), scale bar = 100 nm; (B) Western blotting for CD9; (C) quantification and size distribution of particles by nanoparticle tracking analysis; (D) 8-cell ratio at 24 h; (E) morula ratio at 48 h, (F) blastocyst ratio at 72 h and (G) blastocyst ratio at 96 h in groups: control, EVs at 9.1×10¹⁰ particles/mL, EVs at 9.1×10¹¹ particles/mL, and EVs at 9.1×10¹² particles/mL; (H) representative images of embryos at 24, 48, 72 and 96 h of in vitro culture in the four groups, scale bar = 100 μm; (I) pH value; (J) MAD concentration; and (K) ammonium concentration at 24, 48, 72 and 96 h in culture medium of the four groups. The *above the bars indicates significant difference (P < 0.05) compared with control group.
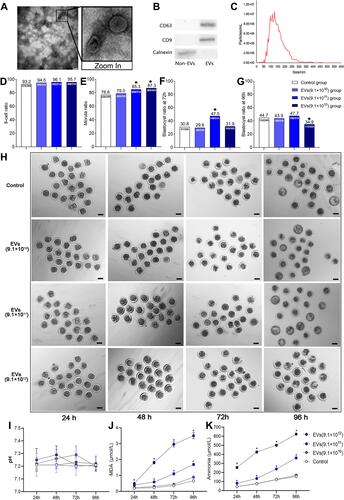
Figure 2 Loss of renewal in the in vitro culture system impairs competence for embryo development. (A) Groups used: non-EVs, fresh EVs, recycled 48 h-EVs, and recycled 96 h-EVs; (B) blastocyst ratio and (C) numbers of cells per blastocyst at 72 h in the non-EVs, fresh EVs, recycled 48 h-EVs, and recycled 96 h-EVs group; (D) representative images of embryos at 72 h of the non-EVs, fresh EVs, recycled 48-EVs, and recycled 96-EVs group (upper panel, bright-field, scale bar = 100 μm; lower panel, DAPI staining in blue); (E) groups used: con-EVs, R-M, R-EVs, and R-EVsM group; (F) blastocyst ratio and (G) numbers of cells per blastocyst at 72 h in the con-EVs, R-M, R-EVs, and R-EVsM group; and (H) representative images of embryos at 72 h from the con-EVs, R-M, R-EVs, and R-EVsM group (upper panel, bright-field, scale bar = 100 μm; lower panel, representative blastocysts stained blue with DAPI). Different letters (the lowercase a, b and c) above the bars indicate significant differences at P < 0.05.
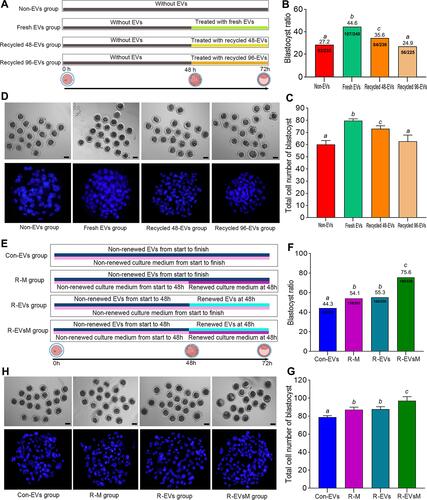
Figure 3 Loss of renewal in the in vitro culture system affects EVs’ role in regulating the embryo transcriptome (con-EVs vs non-EVs). (A) Heatmap showing differentially expressed genes in blastocysts between con-EVs group and non-EVs group, including the in vivo group; (B) consistent and inconsistent genes of the con-EVs group and in vivo group compared to the non-EVs group; (C) GO analysis and KEGG pathway enrichment analysis of the consistent genes; and (D) GO analysis and KEGG pathway enrichment analysis of the inconsistent genes.
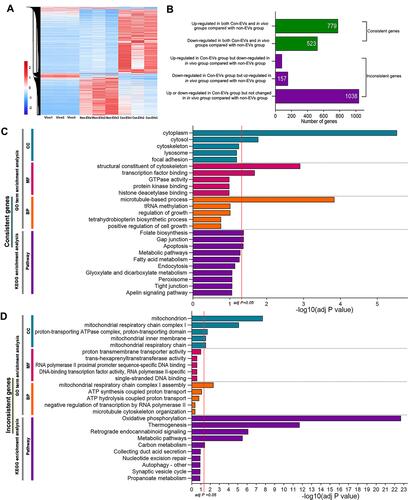
Figure 4 Gain of renewal in the in vitro culture system affects EVs’ role in regulating the embryo transcriptome (R-EVsM vs non-EVs). (A) Heatmap of differentially expressed genes in blastocysts between the R-EVsM group and non-EVs group, including the in vivo group; (B) consistent or inconsistent genes of the R-EVsM group and in vivo group compared to the non-EVs group; (C) GO analysis and KEGG pathway enrichment analysis of the consistent genes; and (D) GO analysis and KEGG pathway enrichment analysis of the inconsistent genes.
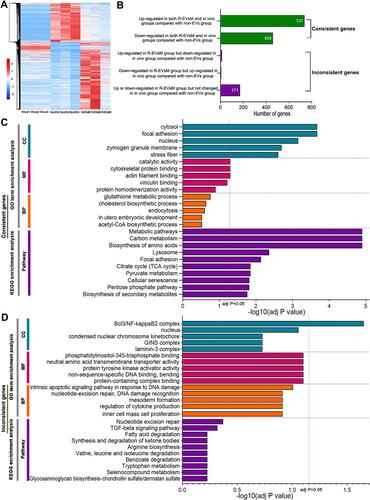
Figure 5 Loss or gain of renewal in the in vitro culture system affects EVs’ role in embryonic production of ROS. (A) MAD concentration and (B) ammonium concentration at 96 h in culture medium of the in vivo group, non-EVs group, con-EVs group, and R-EVsM group. Relative mRNA expression levels of GPX3 (C), SOD2 (D), and GSTM2 (E) in blastocysts at 96 h in the four groups; (F) quantification of ROS by fluorescence intensity in blastocysts at 96 h in the four groups; (G) representative images of ROS staining in blastocysts at 96 h in the four groups (upper panel, bright-field; middle panel, green fluorescence indicating ROS; lower panel merged bright-field and green fluorescence). Different letters (the lowercase a, b, c and d) above the bars indicate significant differences at P < 0.05.
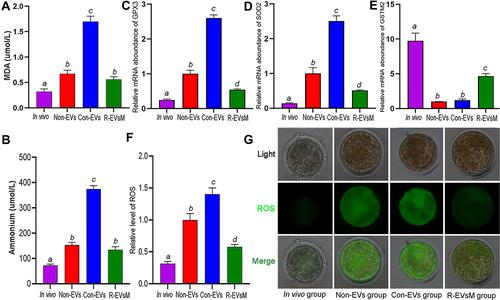
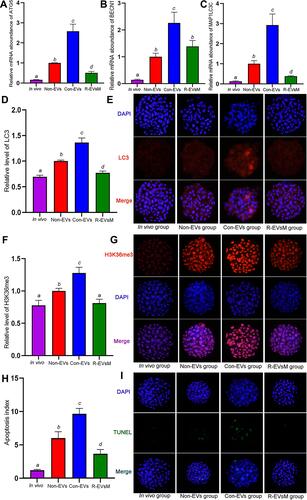
Figure 6 Loss or gain of renewal in the in vitro culture system affects EVs’ role in embryonic autophagy, epigenetic state and apoptosis. (A) Relative mRNA expression levels of ATG5, BECN1 (B), and MAP1LC3C (C) at 96 h in blastocysts from the in vivo group, non-EVs group, con-EVs group, and R-EVsM group; (D) relative fluorescence intensity of LC3 in blastocysts at 96 h from the four groups; (E) representative images showing immunofluorescence of LC3 in blastocysts from the four groups; (F) quantitation of fluorescence intensity of H3K36me3 (red) in blastocysts at 96 h from the four groups; (G) representative images showing immunofluorescence of H3K36me3 (red) in blastocysts from the four groups; (H) apoptotic index of blastocysts at 96 h from the four groups; (I) representative images of TUNEL assay of blastocysts, apoptotic blastomeres (red). Different letters (the lowercase a, b, c and d) above the bars indicate significant differences at P < 0.05.