Figures & data
Figure 1 The transmission electron microscope (TEM) of Ag nanoparticles.
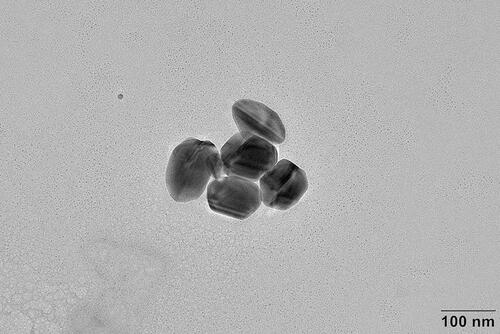
Table 1 Demographics and Clinical Features of the Cohort
Table 2 Tentative Assignments of Significant SERS Shifts in Biological SamplesCitation24–Citation27
Figure 2 Mean SERS spectra of the recurrent group and non-recurrent group.
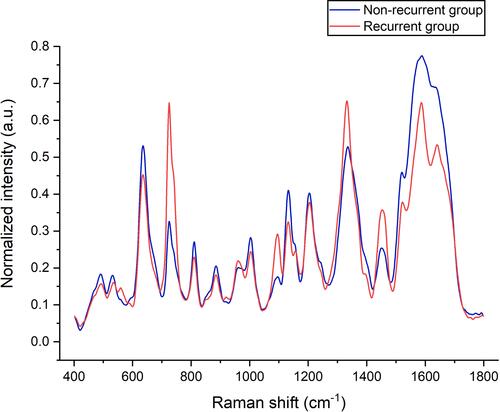
Table 3 Cox Regression Proportional Hazard Analysis of Clinical Variables and SERS Shifts
Figure 3 Distribution of significant SERS peaks’ intensities for recurrent group and non-recurrent group. Bar graph shows the mean spectral intensities at each peak. Scatter diagram shows mean intensities of each sample in specific peaks, *p < 0.05, ***p < 0.001; Error bar indicates standard error of the mean (S.E.M.).
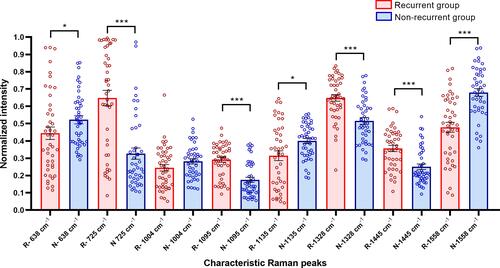
Figure 4 The Kaplan–Meier curve for recurrent patients and non-recurrent patients divided by SERS peak 1558 cm−1.
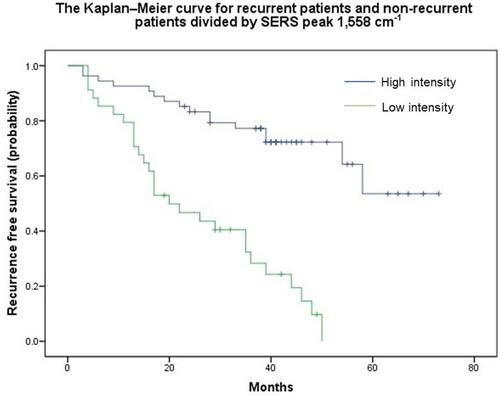
Table 4 The PCA-LDA Model of Recurrent and Non-Recurrent Groups Based on the Raman Spectra of Plasma with Leave-One-Spectrum-Out Cross-Validation
Figure 5 Scatter plot of linear discriminant (LDA) scores for recurrent group and non-recurrent group.
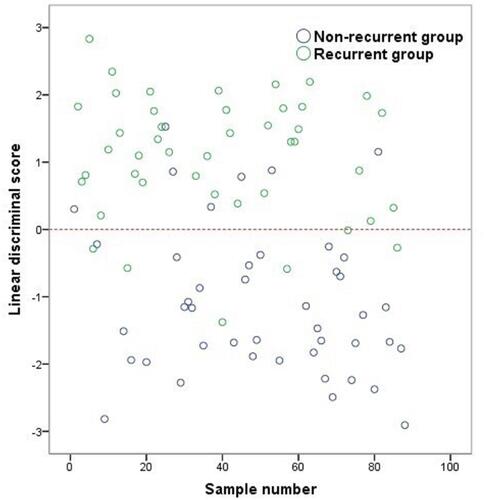
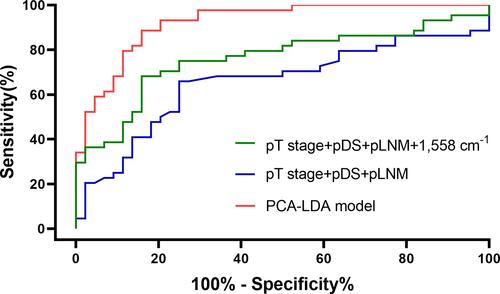
Figure 6 The receiver operating characteristic (ROC) curves of the PCA-LDA model, clinical variables of pathological tumor stage, lymph node metastasis and pathological downstaging, and clinical variables combined with Raman peaks of 1558 cm−1.