Figures & data
Figure 1 UV-visible spectra. (A) The red line indicates the SPR of gold nanorods and the blue line displays the SPR of FACS-R. (B) The red line indicates the SPR of triangular silver nanoplates and the blue line displays the SPR of FACS-T. The black lines indicate the absorbance of FA-CS.
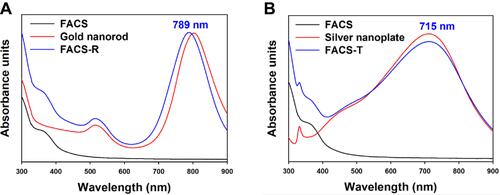
Figure 2 FT-IR spectra. From top to bottom, the spectra represent chitosan (dark red color), folic acid (orange color), FA-CS (yellow color), FACS-R (green color) and FACS-T (blue color).
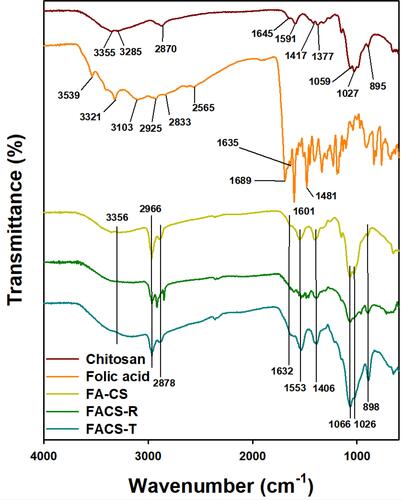
Figure 3 FE-TEM images and HR-XRD patterns of gold nanorods and FACS-R. (A) Schematic illustration of gold nanorods showing the aspect ratio and average size. (B) FE-TEM image of gold nanorods (scale bar: 10 nm). (C) FE-TEM image of gold nanorods (scale bar: 100 nm). (D) FE-TEM image of FACS-R (scale bar: 50 nm). (E) HR-XRD pattern of gold nanorods. (F) HR-XRD pattern of FACS-R.
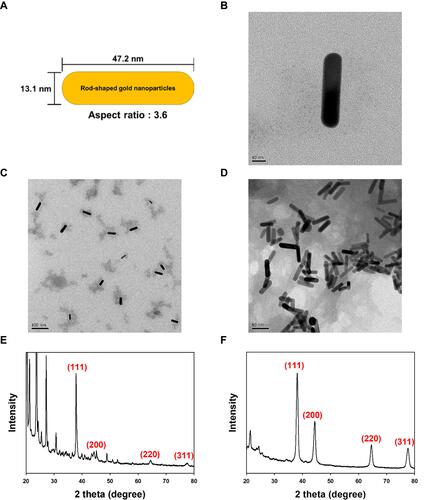
Figure 4 FE-TEM images and HR-XRD patterns of triangular silver nanoplates and FACS-T. (A) Size histogram. (B) FE-TEM image of triangular silver nanoplates. (C) FE-TEM image of triangular silver nanoplates. A stack of nanoplates with a height of approximately 10 nm is shown in the red circle. (D) FE-TEM image of FACS-T. (E) HR-XRD pattern of triangular silver nanoplates. (F) HR-XRD pattern of FACS-T. The scale bar in all FE-TEM images represents 50 nm.
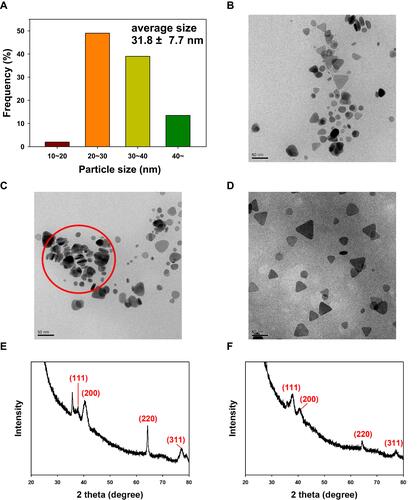
Table 1 Hydrodynamic Size and Zeta Potential of FACS-R, FACS-T and Nanoparticles Encapsulated with DTX, PTX, DADS and SAC
Table 2 Colloidal Stability of FACS-R and FACS-T on the Shelf
Table 3 Colloidal Stability of FACS-R and FACS-T in Five Different Solutions
Table 4 Encapsulation Efficiency of Anticancer Agents in FACS-R and FACS-T
Figure 5 MTT assay on AGS cells. (A) Free anticancer agents (DTX, PTX, DADS and SAC). (B) FACS-R and anticancer agent-encapsulated FACS-R. (C) FACS-T and anticancer agent-encapsulated FACS-T. Significant difference between control and each nanomaterial was expressed as *p < 0.05 and ***p < 0.001, and was calculated with two-tailed Student’s t-test. Significance difference on each sample with different concentration was calculated by one-way ANOVA test (p < 0.001).
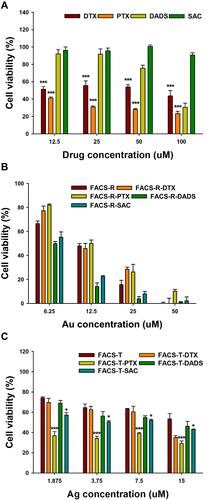
Figure 6 MTT assay on HeLa cells. (A) Free anticancer agents (DTX, PTX, DADS and SAC). (B) FACS-R and anticancer agent-encapsulated FACS-R. (C) FACS-T and anticancer agent-encapsulated FACS-T. Significant difference between control and each nanomaterial was expressed as *p < 0.05 and ***p < 0.001, and was calculated with two-tailed Student’s t-test. Significance difference on each sample with different concentration was calculated by one-way ANOVA test (p < 0.001).
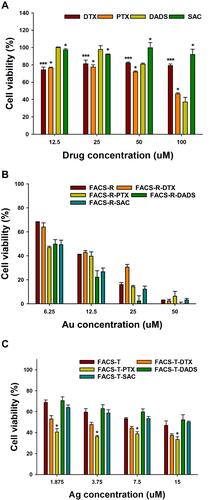
Figure 7 MTT assay on HT-29 cells. (A) Free anticancer agents (DTX, PTX, DADS and SAC). (B) FACS-R and anticancer agent-encapsulated FACS-R. (C) FACS-T and anticancer agent-encapsulated FACS-T. Significant difference between control and each nanomaterial was expressed as ***p < 0.001 and was calculated with two-tailed Student’s t-test. Significance difference on each sample with different concentration was calculated by one-way ANOVA test (p < 0.001).
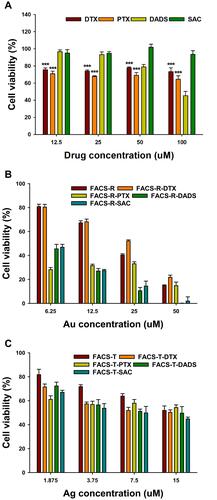
Figure 8 Measurement of the apoptotic population (%) on HeLa cells. The lower-left quadrant, lower-right quadrant, upper-right quadrant and upper-left quadrant represent living, early apoptotic, late apoptotic and necrotic cells, respectively. (A) Control. (B) PTX. (C) FACS-T. (D) FACS-T-PTX. (E) Histogram of the apoptotic rate (%). In the histogram, the green, orange and dark-red colors represent late apoptosis, early apoptosis and necrosis, respectively.
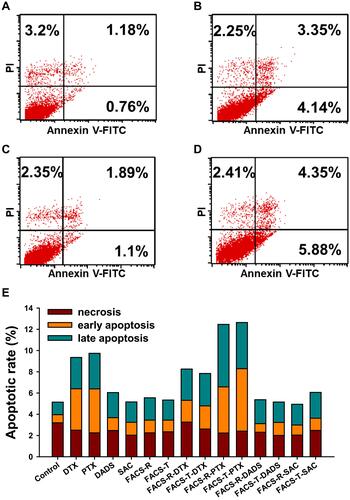
Figure 9 Cell cycle analysis on HeLa cells. (A) Control. (B) PTX. (C) FACS-T. (D) FACS-T-PTX. (E) Histogram of the percentage (%) of cells at each phase. In the histogram, the green, orange and dark-red colors represent the G2/M, S and G0/G1 phases, respectively.
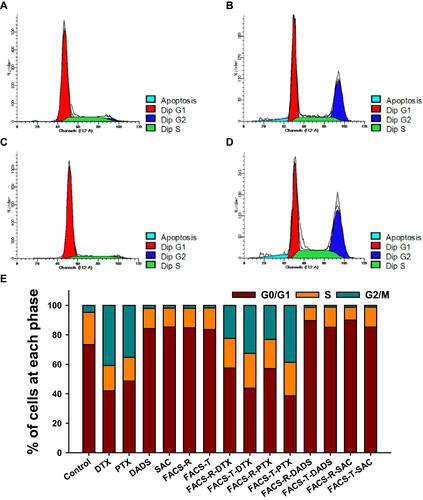
Figure 10 Relationship between temperature (°C) and time (min) during laser irradiation (808 nm laser at a power density of 2 W/cm2 for 6 min). The fixed time points for the measurements were 0, 1, 2, 3, 4, 5 and 6 min. (A) Changes in the temperature (°C) of FACS-R (50 μM), FACS-T (15 μM) and deionized water (as a control) at the fixed time points during laser irradiation. The dark-red circles, orange circles and green inverted triangles represent deionized water, FACS-R and FACS-T, respectively. (B) Change in the temperature (°C) observed with three different concentrations (50, 100 and 150 μM) of FACS-R at fixed time points during laser irradiation. The dark-red circles, orange circles and green inverted triangles represent 50, 100 and 150 μM FACS-R, respectively. (C) Changes in the temperature (°C) obtained with three different concentrations (15, 30 and 45 μM) of FACS-T at fixed time points during laser irradiation. The dark-red circles, orange circles and green inverted triangles represent 15, 30 and 45 μM FACS-T, respectively.
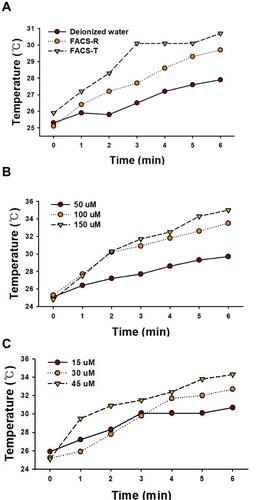
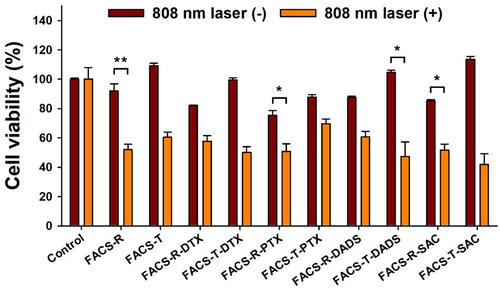
Figure 11 Cell viability on HeLa cells in the presence or absence of laser irradiation (808 nm laser at a power density of 2 W/cm2 for 6 min). The dark red-colored bars indicate the absence of laser irradiation and the orange-colored bars represent the presence of laser irradiation. Significant difference compared to laser on/off was indicated by *p < 0.05 and **p < 0.01, and was calculated with paired t-test.