Figures & data
Figure 1 Representative TEM images (scale bars = 100 nm) of Sovereign Silver (top left) and Argentyn 23 (top right), and nanoparticle size distribution of Argentyn 23 obtained from nine different batches (bottom).
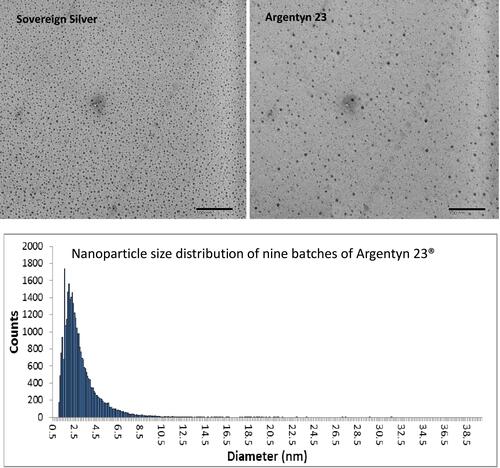
Figure 2 A representative AFM height image of Argentyn 23 and the size distribution histogram. The AFM height image is presented with a mask in red overlaid. The height of the particles is represented by the brightness of the spots against the scale bar to right of image. The size distribution histogram contains data from nine Argentyn 23 batches. A minimum of three images from each batch were analyzed.
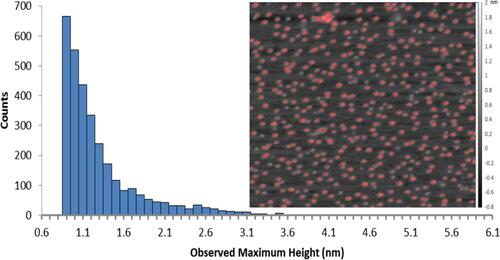
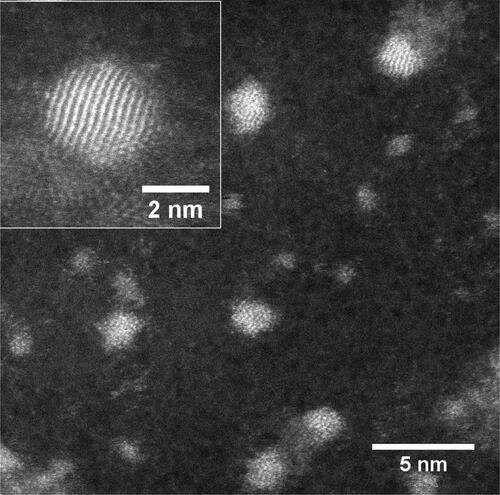
Figure 3 Scanning Transmission Electron Microscopy (S/TEM) images of Sovereign Silver.