Figures & data
Figure 1 Evaluation of the cytotoxicity of ZnO NPs against DLBCL cells and normal cells. The viability of DLBCL cells (A) and PBMCs (B) following treatment with different concentrations of ZnO NPs for 120 hours was determined using MTT assay. The type of cellular death caused by ZnO NPs (30 μg/mL) in DLBCL cells (C) was identified using annexin V-FITC and propidium iodide (PI) with flow cytometer. The data of flow cytometer were presented using column graph (D). ZnO NPs-induced production of ROS was measured in DLBCL cells using DCFH-DA (E). All experiments were performed in triplicate. Asterisk symbol was used to define p values; p ≤ 0.05 is *p ≤ 0.01 is **p ≤ 0.001 is*** and p ≤ 0.0001 is****.
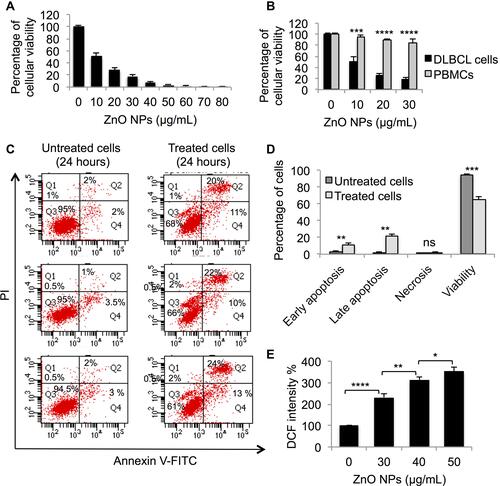
Figure 2 ZnO NPs induced significant changes in the transcriptomic profile of DLBCL cells. Volcano plot demonstrates differentially expressed genes (DEGs: FC≥3; p≤0.008; corrected p≤0.05) in the ZnO NPs-treated DLBCL cells compared with untreated DLBCL cells (A). Hierarchical cluster analysis with heatmap presentation were done for the DEGs (B). The color range represents the normalized signal value of probes (log2 transformation and 75 percentile shift normalization).
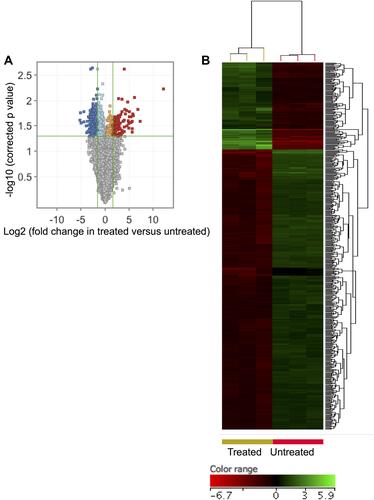
Table 1 Biological Processes and Pathways Enrichment Analysis of the Differentially Expressed Genes (DEGs: FC≥3; P≤0.008; Corrected P≤0.05) in the ZnO NPs-Treated DLBCL Cells Compared with the Untreated DLBCL Cells
Figure 3 Genes identified with over-expression in the ZnO NPs-treated DLBCL cells compared with the untreated DLBCL cells. Hierarchical cluster analysis with heatmap presentation was conducted on the over-expressed genes (FC≥3; p≤0.008; corrected p≤0.05) that significantly over-represented the biological processes and pathways: cellular response to zinc ions (A), response to chemicals (B) and negative regulator of growth (C). The color range represents the normalized signal value of probes (log2 transformation and 75 percentile shift normalization).
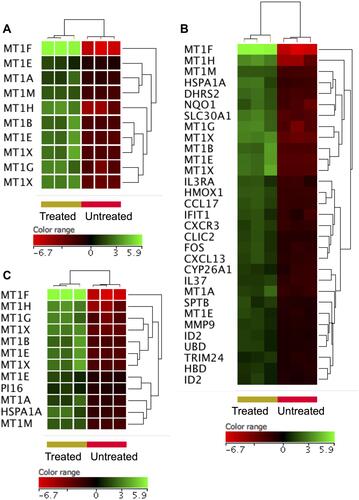
Figure 4 Genes that were under-expressed in the ZnO NPs-treated DLBCL cells compared with the untreated DLBCL cells. Hierarchical cluster analysis with heatmap presentation was conducted on the under-expressed genes (FC≥3; p≤0.008; corrected p≤0.05) that significantly over-represented the biological processes and pathways: negative regulation of transcription (A), chromatin assembly (B), telomere maintenance (C) and NOTCH signaling (D). The color range represents the normalized signal value of probes (log2 transformation and 75 percentile shift normalization).
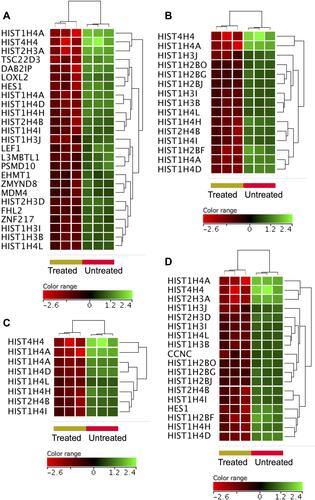
Figure 5 Expression profile of oxidative stress responsive gene. Hierarchical cluster analysis with heatmap presentation was done on oxidative stress responsive gene (FC ≥1.5 with p≤0.05 and corrected p≤0.1) in ZnO NPs treated DLBCL cells versus untreated DLBCL cells. The color range represents the normalized signal value of probes (log2 transformation and 75 percentile shift normalization).
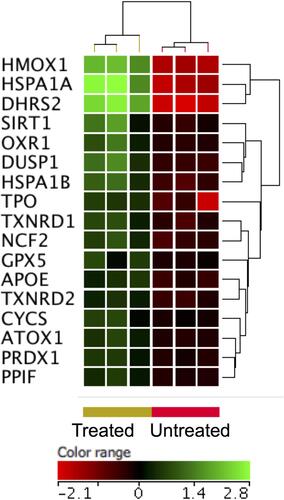
Figure 6 Expression profile of apoptotic gene. Hierarchical cluster analysis with heatmap presentation were constructed for anti-apoptotic genes (A) and pro-apoptotic genes (B) (FC ≥1.5 with p≤0.05 and corrected p≤0.1) in ZnO NPs-treated DLBCL cells compared with untreated DLBCL cells. The color range represents the normalized signal value of probes (log2 transformation and 75 percentile shift normalization).
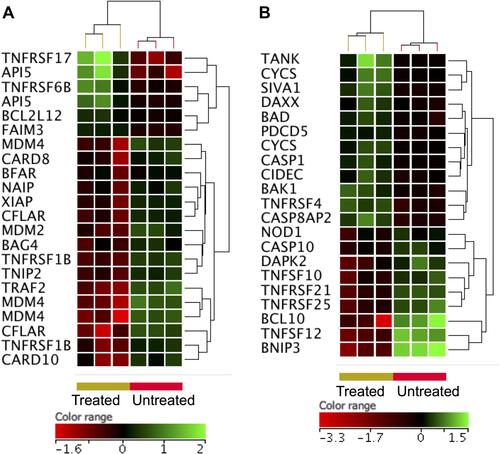
Figure 7 Expression profile of oncogenes. Hierarchical cluster analysis with heatmap presentation were constructed for oncogenes (FC ≥1.5 with p≤0.05 and corrected p≤0.1) in ZnO NPs treated DLBCL cells compared with untreated DLBCL cells. The color range represents the normalized signal value of probes (log2 transformation and 75 percentile shift normalization).
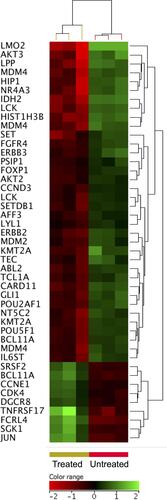
Figure 8 Expression profile of B-cell receptor signaling genes. Hierarchical cluster analysis with heatmap presentation were constructed for the genes (FC ≥1.5 with p≤0.05 and corrected p≤0.1) in ZnO NPs-treated DLBCL cells compared with untreated DLBCL cells. The color range represents the normalized signal value of probes (log2 transformation and 75 percentile shift normalization).
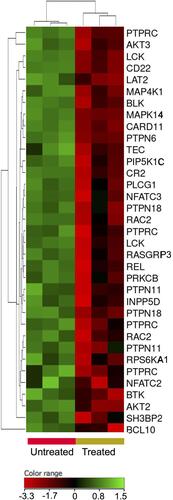
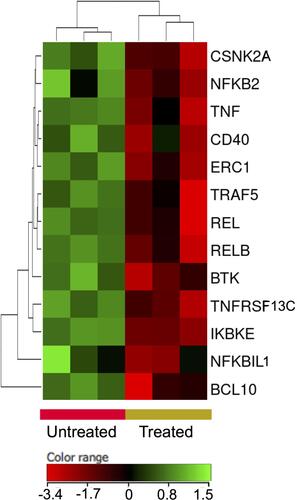
Figure 9 Expression profile of nuclear factor kappa B signaling genes. Hierarchical cluster analysis with heatmap presentation were constructed for the genes (FC ≥1.5 with p≤0.05 and corrected p≤0.1) in ZnO NPs-treated DLBCL cells compared with untreated DLBCL cells. The color range represents the normalized signal value of probes (log2 transformation and 75 percentile shift normalization).