Figures & data
Figure 1 Characterization of chitosan-siRNA complexes. Size (nm) (A), zeta potential (mV) (B), and PDI (C) of chitosan-siRNA complexes.
Note: The chitosan-siRNA complexes were at a chitosan to siRNA Sjogren syndrome antigen weight ratio of 10:1, 50:1, and 100:1, respectively.
Abbreviations: PDI, polydispersity index; MW, molecular weight; siRNA, small interfering RNA.
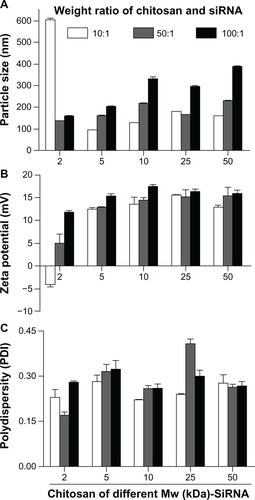
Figure 2 Electrophoresis analysis on 2% agarose gel. Effect of molecular weight of chitosan on siRNA binding efficacy at various chitosan to siRNA Sjogren syndrome antigen weight ratios of (A) 10:1, (B) 50:1, and (C) 100:1.
Notes: Lane 1, ladder 100 base pairs; lane 2, free siRNA (0.5 μg/lane); lane 3, 2 kDa chitosan-siRNA complexes; lane 4, 5 kDa chitosan-siRNA complexes; lane 5, 10 kDa chitosan-siRNA complexes; lane 6, 25 kDa chitosan-siRNA complexes; lane 7, 50 kDa chitosan-siRNA complexes.
Abbreviation: siRNA, small interfering RNA.
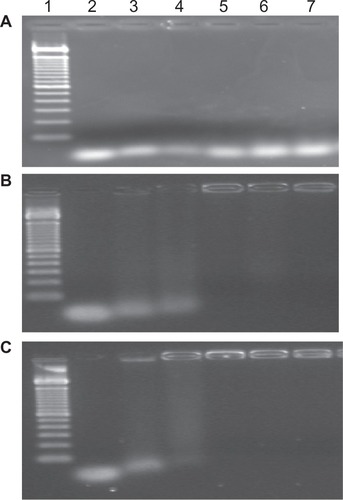
Figure 3 (A) In vitro cytotoxicity of the chitosans (polymer alone) of different molecular weights on HeLa cells as measured by MTT assay. (B) In vitro cytotoxicity of chitosan-siRNA complexes.
Notes: The chitosan-siRNA complexes were at a chitosan to siRNA Sjogren syndrome antigen weight ratio of 10:1, 50:1, and 100:1, respectively.
Abbreviations: MW, molecular weight; siRNA, small interfering RNA.
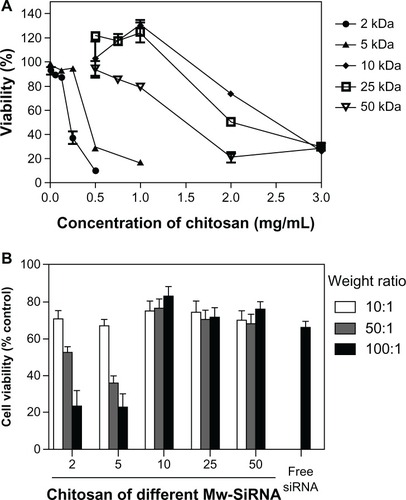
Figure 4 (A) 1H NMR spectrum of folate-chitosan. Solvent DCl/D2O (1:100). (B) Electrophoresis analysis of chitosan or folate-chitosan/siRNA complexes at a weight ratio of 50:1 on 2% agarose gel. Lane 1, free siRNA Sjogren syndrome antigen (0.5 μg/lane); lane 2, 25 kDa chitosan-siRNA; lane 3, 25 kDa folate-chitosan-siRNA; lane 4, 50 kDa chitosan-siRNA; lane 5, 50 kDa folate-chitosan-siRNA. (C) Time course of nanoparticle size (nM). (D) Time course of zeta potential (mV).
Abbreviations: PEG, poly(ethylene glycol); siRNA, small interfering RNA.
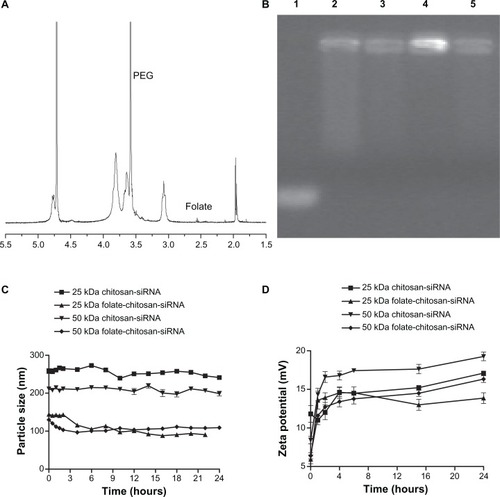
Figure 5 Cell viability. (A) HeLa, (B) OV-3, and (C) MG-63 line cells were transfected with either 5 μg free siRNA SSB or with chitosan-siRNA or folate-chitosan-siRNA complexes containing an equivalent of 5 μg of siRNA SSB.
Notes: Viability was measured with the MTT assay and compared with nontreated cells, which are considered as 100%. Statistical significance was assessed by unpaired Student’s t-test, *P < 0.05; **P < 0.01. Column 1, 25 kDa chitosan-siRNA; column 2, 25 kDa folate-chitosan-siRNA; column 3, 50 kDa chitosan-siRNA; column 4, 50 kDa folate-chitosan-siRNA; column 5, free siRNA.
Abbreviations: FA, folic acid; SBB, Sjogren syndrome antigen; siRNA, small interfering RNA.
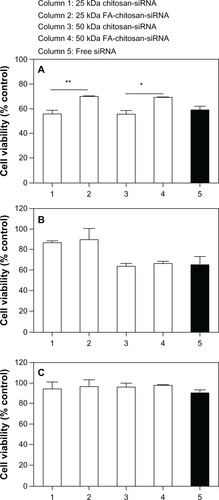
Figure 6 Transfection efficiency in vitro. 5 μg free siRNA SSB or chitosan-siRNA or folate-chitosan-siRNA complexes containing an equivalent of 5 μg of siRNA SSB incubated with (A) HeLa, (B) OV-3, and (C) MG-63 line cells.
Notes: The weight ratio of chitosan or folate-chitosan to siRNA SSB was 50:1. SSB gene expression is measured with real-time RT-PCR and compared with nontreated cells, which are considered as 100%. Statistical significance was assessed by the unpaired Student’s t-test, *P < 0.05; **P < 0.01; P < 0.001. Column 1, 25 kDa chitosan-siRNA; column 2, 25 kDa folate-chitosan-siRNA; column 3, 50 kDa chitosan-siRNA; column 4, 50 kDa folate-chitosan-siRNA; column 5, Free siRNA.
Abbreviations: RT-PCR, reverse transcription-polymerase chain reaction; SBB, Sjogren syndrome antigen; siRNA, small interfering RNA.
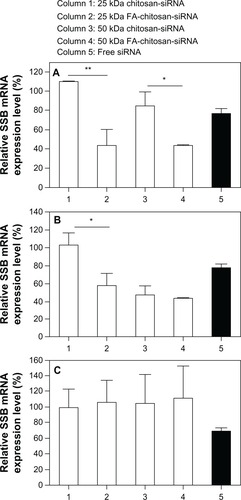
Figure 7 Folic acid competition study. 5 μg free siRNA SSB or chitosan-siRNA or folate-chitosan-siRNA complexes containing an equivalent of 5 μg of siRNA SSB incubated with (A) HeLa and (B) OV-3 line cells with or without 20 μg free folic acid.
Notes: SSB gene expression is measured with real-time RT-PCR and compared with nontreated cells, which are considered as 100%. Statistical significance was assessed by the unpaired Student’s t-test, *P < 0.05; **P < 0.01.
Abbreviations: RT-PCR, reverse transcription-polymerase chain reaction; SBB, Sjogren syndrome antigen; siRNA, small interfering RNA.
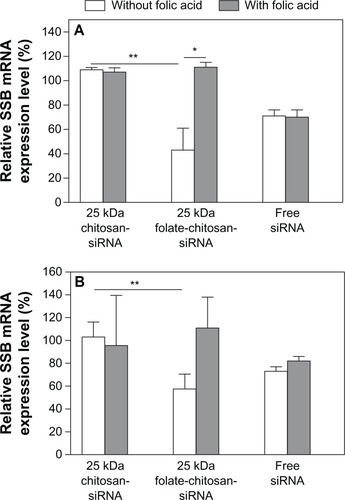
Table S1 Characterization of the chitosans
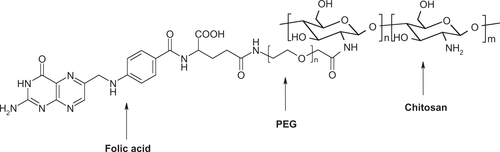
Scheme S1 Synthetic procedure of folate-PEG-chitosan.
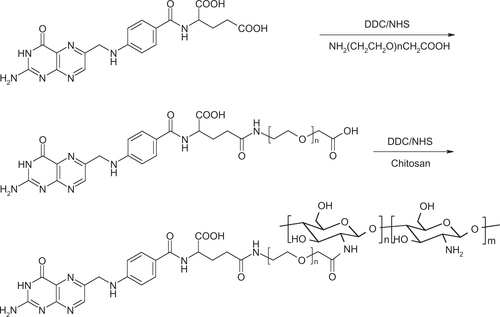
Figure S1 Structure of chitosan-PEG-folate conjugate.