Figures & data
Scheme 1 Preparation (A) and functionality (B) of FeCNPs.
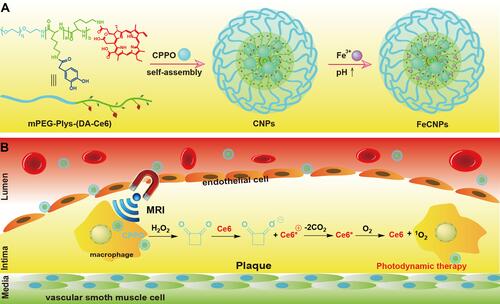
Figure 1 1H-NMR (500 MHz) of (A) mPEG-Plys (Z), (B) mPEG-Plys, and (C) mPEG-Plys (DA-Ce6) in DMSO-d6.
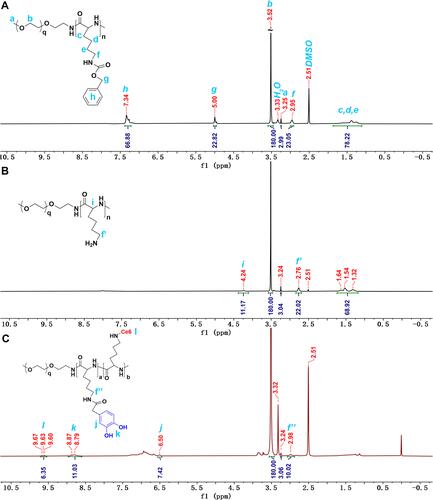
Figure 2 Characterization of nanoparticles. Morphology of BNPs (A) and FeNPs (B). (C) Absorption spectra of Ce6 and FeNPs. (D) Emission spectra and fluorescence images of Ce6, BNPs, and FeNPs excited at 405 nm. (E) T1-weighted MRI (left) and longitudinal plots (right) of FeNPs at various concentrations. (F) Chemiluminescence intensity of BNPs, FeNPs, CNPs and FeCNPs with H2O2 added. Inset: chemiluminescence images. (G) Chemiluminescence intensity of FeCNPs incubated with different concentrations of H2O2. (H) UV-vis absorption spectra of ABDA incubated with FeCNPs and H2O2 at different time points.
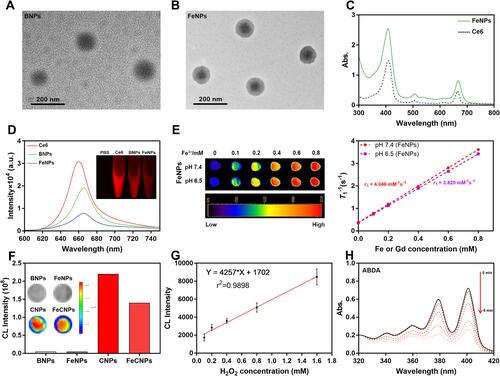
Figure 3 (A) CLSM images and (B) quantitative analysis by flow cytometry of RAW264.7 macrophages with or without activation treated with FeNPs. The nuclei were labeled with DAPI. Bar 50 μm. SOSG fluorescence in LPS-activated RAW264.7 treated with PBS, FeNPs and FeCNPs imaged by CLSM (C) and analyzed by flow cytometry (D). Bar 100 μm. (E) Cytotoxicity of RAW264.7 with or without activation treated with FeCNPs. (F) Cytotoxicity of RAW264.7 incubated with different concentration of H2O2 and then treated with FeCNPs. *p<0.05; **p<0.01; ***p<0.001.
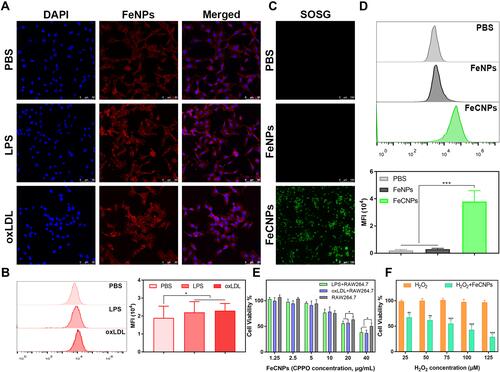
Figure 4 (A) T1-weighted MRI of brachiocephalic artery of high fat–diet ApoE–/– mice treated with FeCNPs and gadodiamide. (B) Ex vivo representative images of aortae and major organs of high fat–diet ApoE–/– mice treated with low and high dose of FeCNPs for 24 hours and 48 hours.
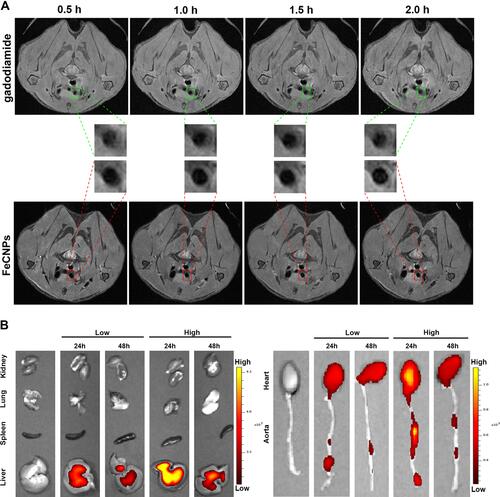
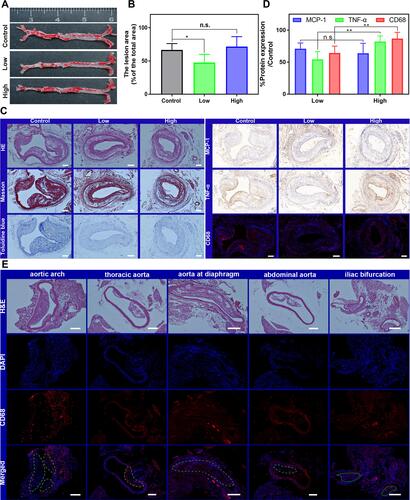
Figure 5 (A) Representative images of ORO-stained aortae from high fat–diet ApoE–/– mice after treatment. (B) Lesion-area ratio of ORO-stained area to whole area. *p<0.05. (C) Immunohistochemistry and immunostaining of aortic arch sections after treatment. Bar 100 μm. (D) Quantitative analysis of expression of MCP1, TNFα, and CD68. *p<0.05; **p<0.01. (E) H&E staining and immunofluorescence staining of CD68 in five parts of the aorta from mice treated with low-dose FeCNPs. The green circle represents the region of plaques. Bar 100 μm.