Figures & data
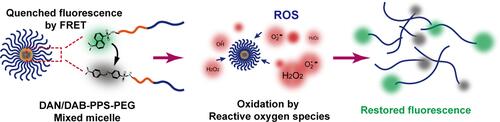
Scheme 1 The illustration of the self-assembling of the DAN/DAB-PPS-mPEG micelles and their fluorescent restoration upon oxidation in the inflammatory cells.
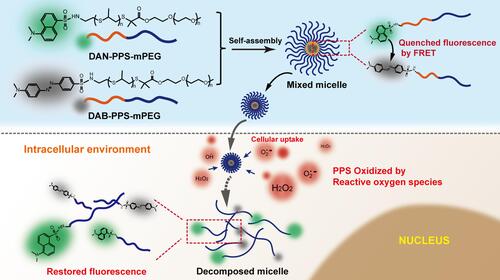
Figure 1 Synthesis scheme of DAN/DAB-PPS-mPEG block copolymers.
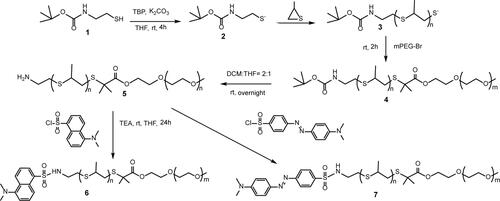
Figure 2 Characterizations of synthesized polymers. (A) 1H-NMR spectrum and peak assignments of DAN-PPS-mPEG, (B) 1H-NMR spectrum and peak assignments of DAB-PPS-mPEG, (C) GPC traces of synthesized polymers.
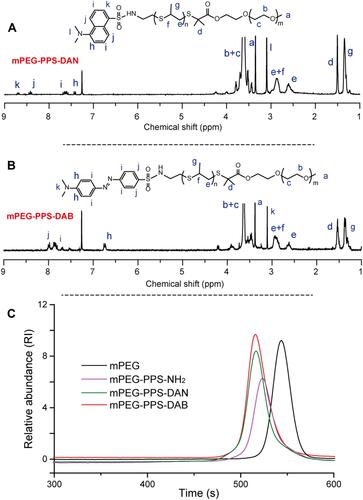
Figure 3 The characterizations of DAN/DAB-PPS-mPEG mixed micelles. (A) The size distributions of DAN/DAB-PPS-mPEG mixed micelles and Nile Red loaded mixed micelles; (B) The SEM graph of DAN/DAB-PPS-mPEG mixed micelles; (C) The SEM graph of Nile Red loaded mixed micelles.
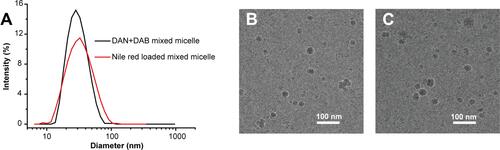
Figure 4 The characterizations of DAN/DAB-PPS-mPEG mixed micelles. (A) Fluorescent emission spectrum of mixed micelles (excitation at 335 nm); (B) Fluorescent emission spectrum of mixed micelles (excitation at 560 nm); (C) The change of the scattering intensities of the micelles upon oxidation; (D) The percentage change of dansyl and Nile Red fluorescence and scattering intensities upon oxidation.
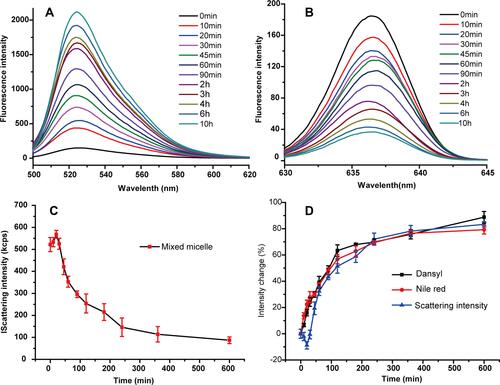
Figure 5 Confocal laser microscopic images of inflammatory fibroblast cell lines. (Control) Cells incubated with DAN/DAB-PPS-mPEG; (Rosup-L) cells incubated with Rosup (5 uM) and DAN/DAB-PPS-mPEG mixed micelles; (Rosup-H) cells incubated with Rosup (20 uM) and DAN/DAB-PPS-mPEG mixed micelles. Green channel showed the fluorescence of dansyl group and red channel showed the fluorescence of Nile Red.
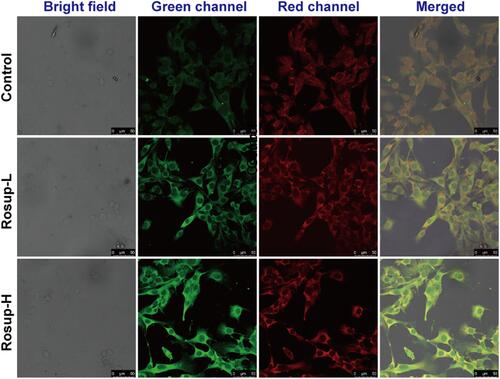
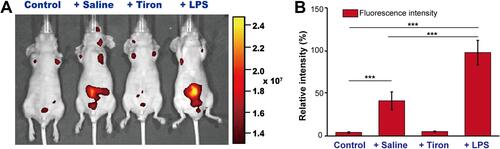
Figure 6 In vivo imaging of the inflammatory reactions using DAN/DAB-PPS-mPEG mixed micelles. (A) control: a mouse without surgery before administration of mixed micelles; Saline: a mouse pre-injected with saline before administration of mixed micelles; Tiron: a mouse pre-injected with Tiron before administration of mixed micelles; LPS: a mouse pre-injected with LPS before administration of mixed micelles; (B) statistical and analysis of the fluorescence intensity of the four groups (n=5). It was considered to be very significant when p < 0.005 (***).