Figures & data
Scheme 1 Schematic illustration of the preparation of PLGA-g-PVP/PC NFm and the antiadhesion and anti-inflammatory assays in vivo and in vitro.
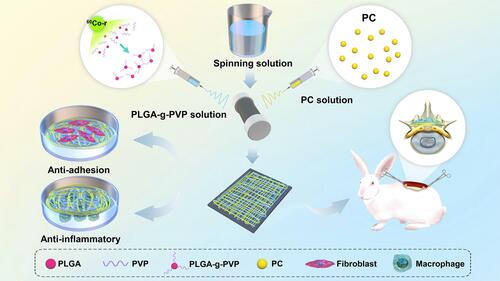
Table 1 Electrospinning Parameters
Scheme 2 Modeling process. (A) Preoperative preparation of the incision site; (B) exposed lamina; (C) removed spinous process; (D) removed lamina; (E) spinal dura mater covered by NFm.
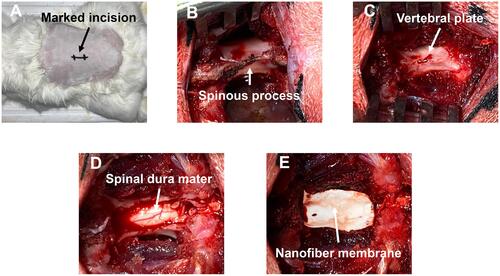
Figure 1 The chemical structural formulas of NVP (A), PLGA (B), and PC (C). (D) FTIR spectra of PLGA NFm, PLGA-g-PVP NFm, and PLGA-g-PVP/PC2 NFm.
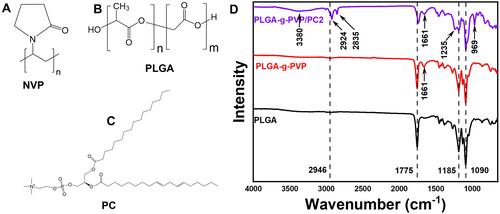
Figure 2 Photographic images (A) and SEM images (B) of prepared PLGA NFm, PLGA-g-PVP NFm, PLGA-g-PVP/PC1 NFm and PLGA-g-PVP/PC2 NFm (Bar = 10 μm). (C) The diameter distribution of each NFm group.
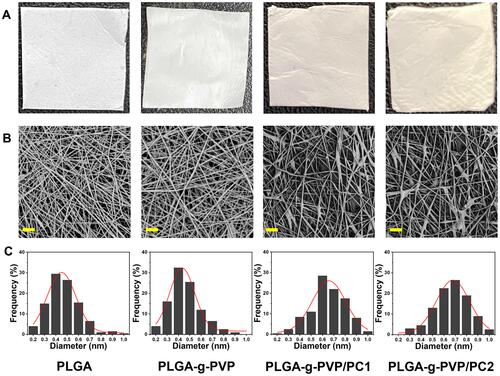
Figure 3 Thermogravimetric analysis results showing different thermal stabilities of PLGA (A), PLGA-g-PVP (B), PLGA-g-PVP/PC1 (C), and PLGA-g-PVP/PC2 (D) NFm.
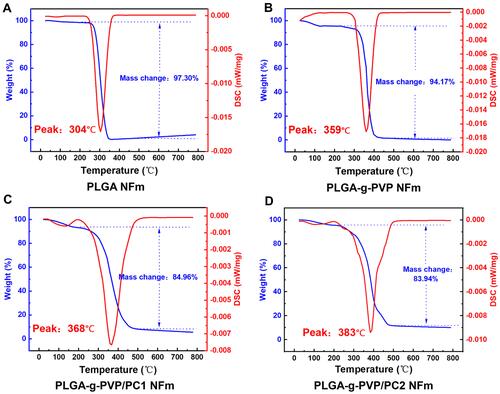
Figure 4 (A) A water droplet was photographed after dropping onto each NFm surface group for 10s. (B) Water contact angle. (C) Water absorption capacity. (D) The degradation of each NFm group at different time points (1, 2, 3, and 4 weeks) under simulated physiological conditions (PBS at 37 °C). ①, PLGA NFm; ②, PLGA-g-PVP NFm; ③, PLGA-g-PVP/PC1 NFm; ④PLGA-g-PVP/PC2 NFm.
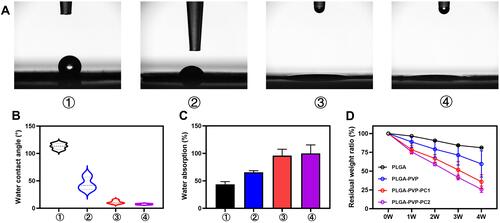
Figure 5 (A) The expression of vimentin in PRFs under a fluorescence microscope. Viability of PRFs (B) and RAW264.7 cells (C) incubated with each NFm group after 24 h. ①, PLGA NFm; ②, PLGA-g-PVP NFm; ③, PLGA-g-PVP/PC1 NFm; and ④, PLGA-g-PVP/PC2 NFm.
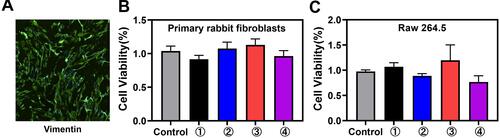
Figure 6 (A) The PRFs number of adhesions on each group NFm was detected by Calcein-AM/PI staining. Effects of NFm on the levels of IL-10 (B) and TNF-α (C) in activated RAW264.7 cells. *p < 0.05, **p < 0.01 vs the control. ①, PLGA NFm; ②, PLGA-g-PVP NFm; ③, PLGA-g-PVP/PC1 NFm; ④, PLGA-g-PVP/PC2 NFm. Scale bar = 200 μm.
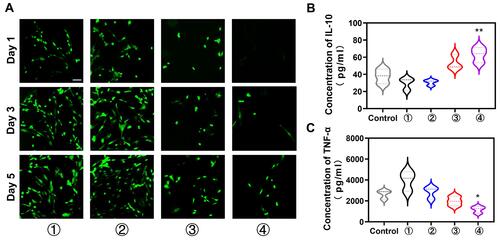
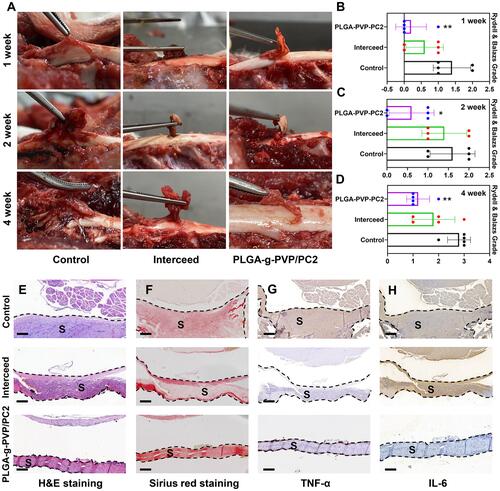
Figure 7 (A) Visual evaluation of adhesion status in different groups. (B–D) Adhesion scores in different groups. (E) H&E staining. (F) Sirius red staining. (G) Immunohistochemical staining analyses of TNF-α (G) and IL-6 (H). *p < 0.05, **p < 0.01 vs the control. Scale bar = 400 μm. (S) scar tissue.