Figures & data
Scheme 1 (A) Schematic illustration for in situ co-delivery of doxorubicin and cisplatin by injectable thermosensitive PLGA-PEG-PLGA hydrogels for synergistic enhanced osteosarcoma treatment.
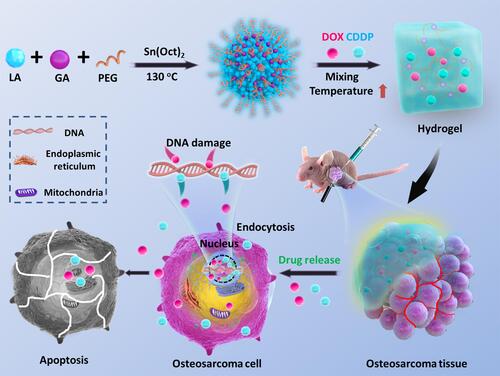
Table 1 Characterization of the PLGA-PEG-PLGA Triblock Copolymers
Table 2 Sequences of Primers Used for Realtime PCR
Figure 1 (A) 1H NMR spectrum of triblock PLGA-PEG-PLGA copolymer. (B) Sol-gel phase diagrams of the PLGA-PEG-PLGA copolymer aqueous solutions and DOX/CDDP co-loaded copolymers. (C) In vitro Gel mass degradation behavior incubated in PBS. (D) In vitro biocompatibility of PLGA-PEG-PLGA copolymers against Saos-2, MG-63 and L929 cell lines, with PEI25K as a positive control.
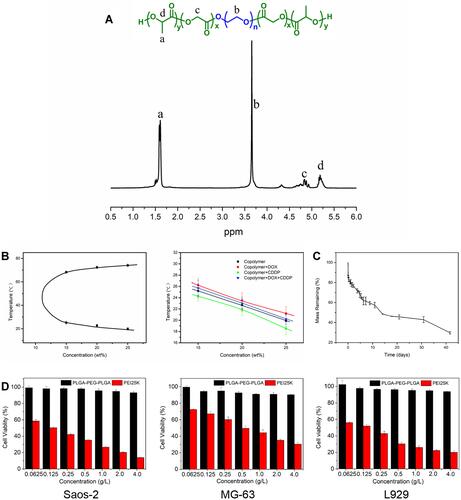
Figure 2 (A) DOX and (B) CDDP release profiles from the PLGA-PEG-PLGA hydrogels with the drug concentration of 1 mg/mL in PBS at 37 °C in vitro. (C) In vitro cytotoxicities efficacy of DOX and CDDP loaded hydrogels against Saos-2 and MG-63 cells and combination index of DOX and CDDP co-loaded hydrogels after incubation for 24h and 48h. (D) Cellular DOX uptake: ClSM microimages of Saos-2 and MG-63 after incubated with a) DOX, b) Gel+DOX, c) DOX+CDDP, d) Gel+DOX+ CDDP. The cellular cytoskeleton and nuclei of cells were stained with Alexa 488 (green) and DAPI (blue) respectively.
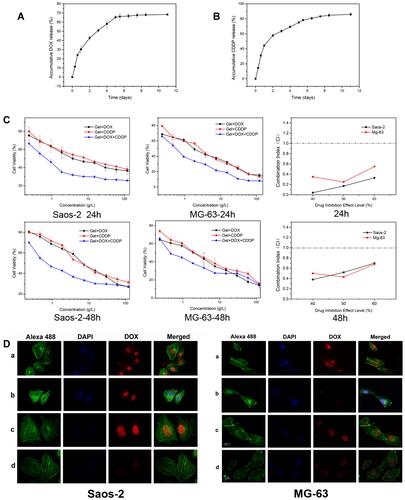
Figure 3 In vivo anti-tumor efficacy of drugs-loaded hydrogels after single injection to the vicinity of the tumors of human osteosarcoma xenografts. (A) Tumor volume. (B) The body weights of mice during the treatments. (C) The tumor weights from the mice sacrificed. (**p<0.01, ***p<0.001). (D) Individual tumor growth curves after treatment. (E) Ex vivo histological H&E staining and TUNEL assay analyses of tumor sections after various treatments. Nuclei were stained blue, and extracellular matrix and cytoplasm were stained red in H&E staining. Green fluorescence indicated apoptotic cells in TUNEL analysis.
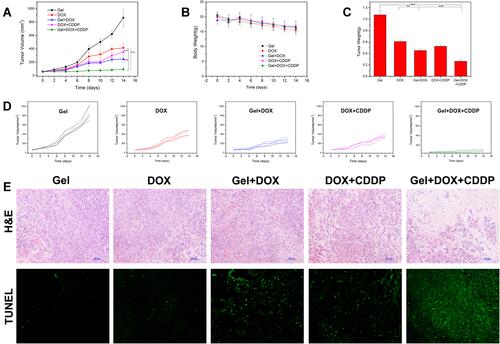
Figure 4 (A) Apoptosis rate of osteosarcoma Saos-2, MG-63 in vitro determined by Annexin V-APC/7-AAD staining after incubated with different formulation. (B) In vitro analysis of the expression of apoptosis-related genes in Saos-2 by quantitative Real-Time PCR, including Bcl-2, BAX, and Caspase-3. Data were normalized to β-actin (n=3). (C) Ex vivo analysis of the expression of apoptosis-related genes in tumor masses after various treatments. (***p<0.001).
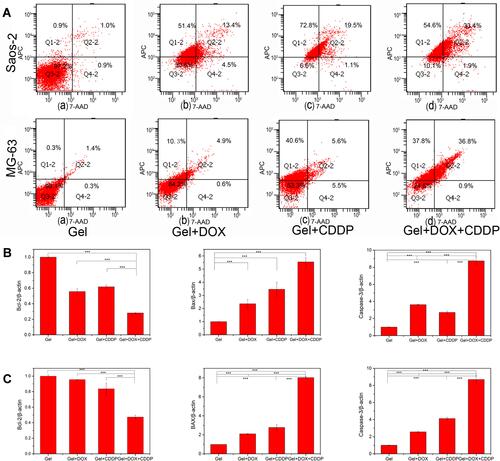
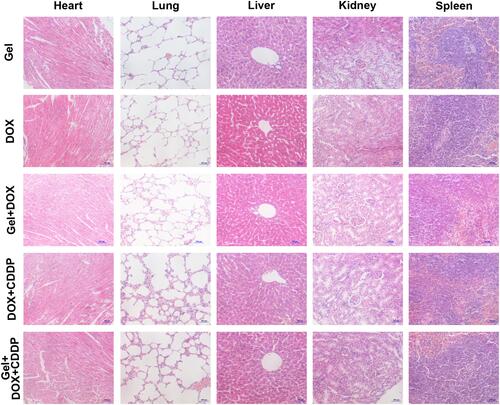
Figure 5 Histological H&E staining of the mice organs after different treatments: Gel, DOX, Gel+DOX, DOX+CDDP and Gel+DOX+CDDP.