Figures & data
Figure 1 Morphology of GFP-ADSCs from subcutaneous fat pads cultured in vitro. (A) After being plated in a Petri dish for 24 hours, the primary adherent cells grew into spindle-shaped or stellate-shaped cells. (B) Green fluorescence of (A) was observed under fluorescence microscopy. (C) At the third passage, the GFP-ADSCs appeared to adopt a more uniform fibroblast-like shape with directionality and regularity. (D) Green fluorescence of C was observed under fluorescence microscopy.
Note: Scale bar measures 100 μm.
Abbreviations: GFP-ADSCs, green fluorescent protein adipose-derived stem cells; BF, bright field; FL, fluorescent light.

Figure 2 Flow cytometry analysis of GFP-ADSC surface antigen, CD90, and CD105 were positive, whereas CD11b, CD31, CD34, CD83, and CD133 were negative, and the isotype control was also negative.
Abbreviation: GFP-ADSCs, green fluorescent protein adipose-derived stem cells.
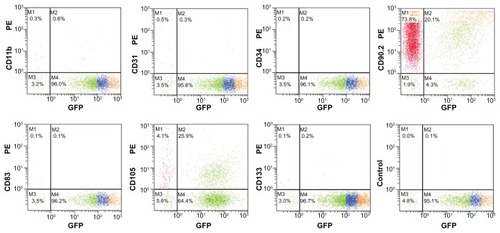
Figure 3 Multipotent differentiation of GFP-ADSCs. (A) Alizarin Red detected calcium mineralization in osteogenic cultures of GFP-ADSCs for 3 weeks in vitro. (B) Oil Red O staining detected red-colored oil granules in adipogenic cultures of GFP-ADSCs (magnified view of the square area in [B]). (C and D) For chondrogenic differentiation, histological and hematoxylin and eosin staining results showed that cartilage lacunae were formed and expressed chondrocyte gene markers, collagen II (C and D).
Notes: Scale bar A measures 25 μm, B, C, and D measure 100 μm.
Abbreviation: GFP-ADSCs, green fluorescent protein adipose-derived stem cells; HE, hematoxylin and eosin.
![Figure 3 Multipotent differentiation of GFP-ADSCs. (A) Alizarin Red detected calcium mineralization in osteogenic cultures of GFP-ADSCs for 3 weeks in vitro. (B) Oil Red O staining detected red-colored oil granules in adipogenic cultures of GFP-ADSCs (magnified view of the square area in [B]). (C and D) For chondrogenic differentiation, histological and hematoxylin and eosin staining results showed that cartilage lacunae were formed and expressed chondrocyte gene markers, collagen II (C and D).Notes: Scale bar A measures 25 μm, B, C, and D measure 100 μm.Abbreviation: GFP-ADSCs, green fluorescent protein adipose-derived stem cells; HE, hematoxylin and eosin.](/cms/asset/244ff272-7235-43c6-91fd-443b5ef4eb43/dijn_a_35647_f0003_c.jpg)
Figure 4 Prussian blue staining, TEM examination, and cell viability of labeled GFP-ADSCs. (A) Prussian blue staining showed numerous blue-stained iron particles in the cytoplasm in nearly 100% of cells. (B) No stainable iron was detected in unlabeled cells. (C) TEM results indicates that the iron particles accumulated in the endosomes/ lysosomes. (D) CCK-8 assay results showed that cell viability was not affected by SPIO at iron concentrations less than 50 μg/mL.
Note: Scale bar measures 100 μm.
Abbreviations: TEM, transmission electron microscopy; CCK-8, cell counting kit-8; SPIO, superparamagnetic iron oxide particles; GFP-ADSCs, green fluorescent protein adipose-derived stem cells.
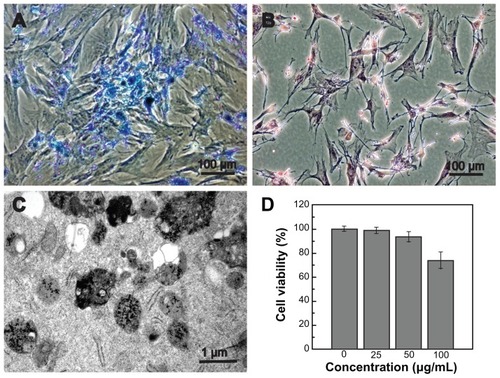
Figure 5 Magnetic resonance imaging of SPIO-labeled GFP-ADSCs in vitro. (A) Different cell populations labeled with SPIO were visible on T2-weighted images. (B) MRI signal intensity of labeled cells was inversely correlated with the number of labeled GFP-ADSCs in T2-weighted images in vitro.
Abbreviations: GFP-ADSCs, green fluorescent protein adipose-derived stem cells; MRI, magnetic resonance imaging; SPIO, superparamagnetic iron oxide particles.
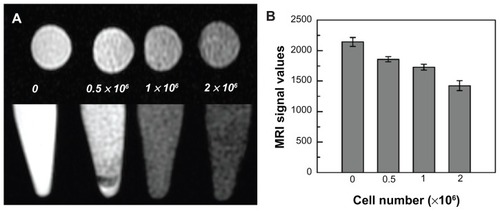
Figure 6 Representative T2-weighted magnetic resonance images of C57BL/6 mice transplanted with GFP-ADSCs. SPIO-labeled GFP-ADSCs in the left carotid artery area (arrows) before (A), 1 day (B), 3 days (C), 7 days (D), 14 days (E), 21 days (F), 30 days (G), and control (H) after transplantation.
Abbreviation: GFP-ADSCs, green fluorescent protein adipose-derived stem cells.
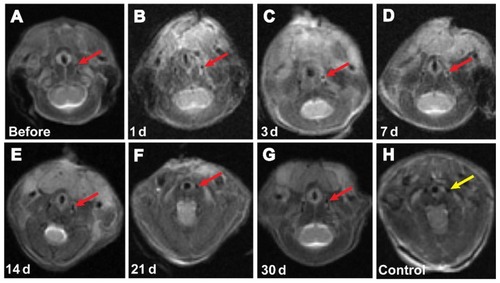
Figure 7 Magnetic resonance imaging (MRI) signal intensity curves obtained from the local vascular wall of the injured common carotid artery.
Notes: At days 1 and 3, the MRI signal values showed a modest reduction, and statistically significant changes in signal levels were observed at 7 days (P < 0.05), as indicated by the curve. Afterwards, the signal levels gradually increased to normal levels on day 30.
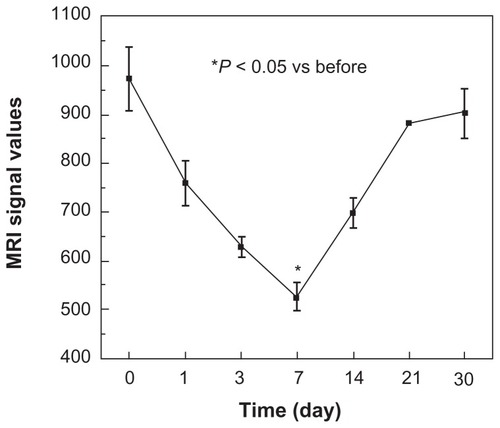
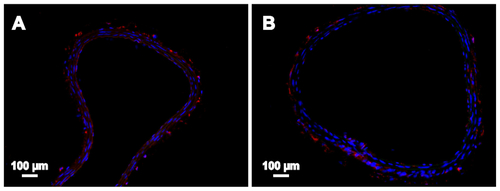
Figure 8 Histological examination of the injured carotid artery 7 days after transplantation. (A) Blue-stained particles were observed in the lesion area (magnified view of the square area in [A]). (B) GFP-ADSCs homing into the injured lesions and differentiated into endothelium were visualized using fluorescence microscopy of GFP and CD31 (red) after nuclear staining with DAPI (magnified view of the square area in [B]). (C) TEM results indicate that the iron particles accumulated in the lesion area. (D) Macrophage mark F4/80 (red) could be detected at 7 days.
Note: Scale bar A, B, and D measure 100 μm; C measures 0.5 μm.
Abbreviations: DAPI, 4′, 6-diamidino-2-phenylindole; GFP-ADSCs, green fluorescent protein adipose-derived stem cells; TEM, transmission electron microscopy.
![Figure 8 Histological examination of the injured carotid artery 7 days after transplantation. (A) Blue-stained particles were observed in the lesion area (magnified view of the square area in [A]). (B) GFP-ADSCs homing into the injured lesions and differentiated into endothelium were visualized using fluorescence microscopy of GFP and CD31 (red) after nuclear staining with DAPI (magnified view of the square area in [B]). (C) TEM results indicate that the iron particles accumulated in the lesion area. (D) Macrophage mark F4/80 (red) could be detected at 7 days.Note: Scale bar A, B, and D measure 100 μm; C measures 0.5 μm.Abbreviations: DAPI, 4′, 6-diamidino-2-phenylindole; GFP-ADSCs, green fluorescent protein adipose-derived stem cells; TEM, transmission electron microscopy.](/cms/asset/fe7da878-7560-4696-aafe-5b91218a778b/dijn_a_35647_f0008_c.jpg)
Figure 9 Histological examination of the injured carotid artery 30 days after transplantation. (A) Blue-stained particles were observed in the lesion area (magnified view of the square area in [A]). (B) GFP-ADSCs homing into the injured lesions were visualized and assayed by fluorescence microscopy of GFP and CD31 (red) after nuclear staining with DAPI. (C) The macrophage marker F4/80 (red) could be detected after 30 days.
Note: Scale bar measures 100 μm.
Abbreviation: GFP-ADSCs, green fluorescent protein adipose-derived stem cells; DAPI, 4′, 6-diamidino-2-phenylindole.
![Figure 9 Histological examination of the injured carotid artery 30 days after transplantation. (A) Blue-stained particles were observed in the lesion area (magnified view of the square area in [A]). (B) GFP-ADSCs homing into the injured lesions were visualized and assayed by fluorescence microscopy of GFP and CD31 (red) after nuclear staining with DAPI. (C) The macrophage marker F4/80 (red) could be detected after 30 days.Note: Scale bar measures 100 μm.Abbreviation: GFP-ADSCs, green fluorescent protein adipose-derived stem cells; DAPI, 4′, 6-diamidino-2-phenylindole.](/cms/asset/f4ec80ee-abf0-4764-b26e-74e08ce119ba/dijn_a_35647_f0009_c.jpg)
Figure S1 Morphology of GFP-ADSCs labeled with 25μg/mL SPIO.
Notes: (A) Bright field of cells labeled with 25μg/mL SPIO. (B) Fluorescent microscopy image of the same view of A showed GFP expression of whole labeled cells. (C) Negative control cells without treatment with SPIO. (D) The same view of C was observed under fluorescence microscopy. Scale bar measures 100 μm.
Abbreviations: GFP-ADSCs, green fluorescent protein-adipose-derived stem cells; BF, bright field; FL, fluorescent light.
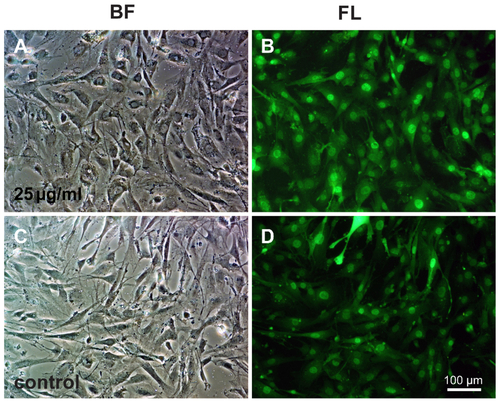
Figure S2 Annexin V staining analysis of apoptosis in GFP-ADSCs labeled with 25 μg/ml SPIO.
Notes: (A) Negative control cells without treatment with SPIO. (B) GFP-ADSCs labeled with 25 μg/mL SPIO.
Abbreviation: GFP-ADSCs, green fluorescent protein adipose-derived stem cells.
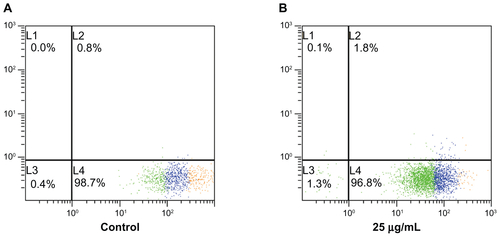
Figure S3 Cell cycle of labeled or unlabeled GFP-ADSCs with 25 μg/ml SPIO.
Notes: FCM showed that about 86.121% of unlabeled GFP-ADSCs (A) and about 83.052% of labeled GFP-ADSCs (B) were in proliferative state (S phase).
Abbreviations: GFP-ADSCs, green fluorescent protein adipose-derived stem cells; FCM, Flow Cytometry Method.
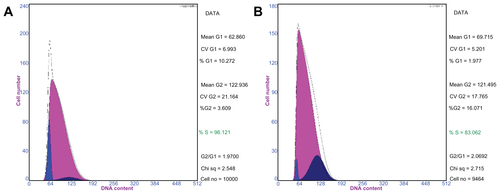
Figure S4 Prussian blue staining, TEM examination of the control groups.
Notes: (A) Prussian blue staining showed no blue-stained iron particles in the lesion area of the control animals. (B) TEM further demonstrated no iron particles accumulated in the lesion area of the control animals. Scale bar A measures 100 μm, B measures 2 μm.
Abbreviation: TEM, transmission electron microscope.
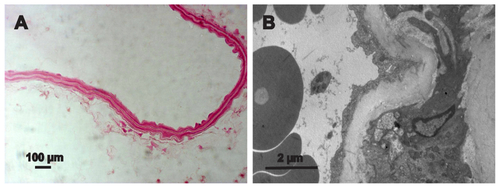
Figure S5 Histological Examination of the injured carotid artery at day 7 and 30 following transplantation.
Notes: (A) Macrophage mark MAC-3 could be detected at 7 d. (B) The number of macrophage was obviously decreasing at 30 d. Scale bar measures 100 μm.