
Figures & data
Table 1 Isolated Fungi from Different Locations in Saudi Arabia
Figure 1 Unrooted neighbor-joined phylogenetic tree of the three fungi isolates based on 18S ribosomal DNA. The tree was constructed based on 18S rDNA partial gene sequence of fungi isolates. The GenBank accession numbers of isolates are marked at the end of the branch. The GenBank accession numbers of closely related species are placed at the top of the branch and derived using NCBI nucleotide BLAST search tool. Sequences were aligned using Clustal W sequence alignment tool in MEGA X software. Bootstrap percentage values as obtained from 1000 replications of the data set are given at the tree’s nodes. The scale bar corresponds to the mean number of nucleotide substitutions per site.
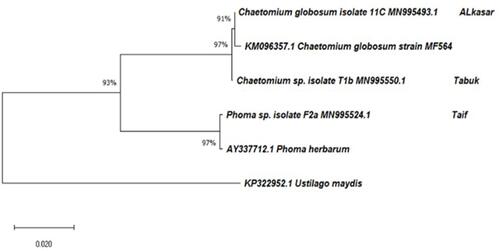
Figure 2 Biosynthesis of AgNPs indicated by color change for the reaction medium composed of 1 mM AgNO3 and fungal filtrates after 24 h (left side) and fungal filtrate (right side).
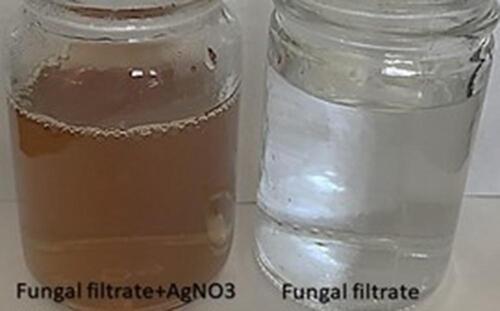
Figure 3 The UV-vis spectrum of the P-AgNPs (A), G-AgNPs (B), and C-AgNPs (C).
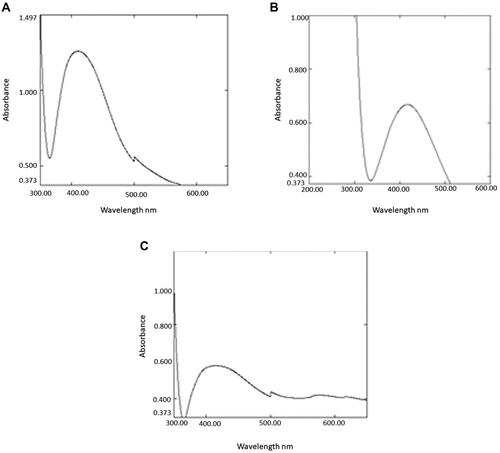
Figure 4 TEM image presenting morphological features for NPs and frequency distribution. Size measurements were analyzed by ImageJ software constructed from TEM micrographs for P-AgNPs (A1–A3), G-AgNPs (B1–B3), and C-AgNPs (C1–C3).
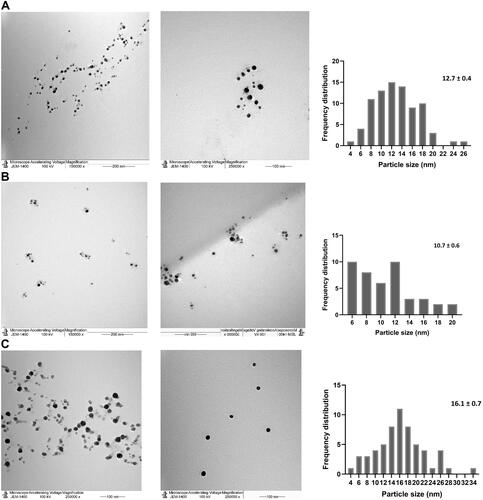
Figure 5 EDX of P-AgNPs (A), G-AgNPs (B), and C-AgNPs (C) indicating surface morphology quantitative analysis of silver atoms, carbon, and oxygen.
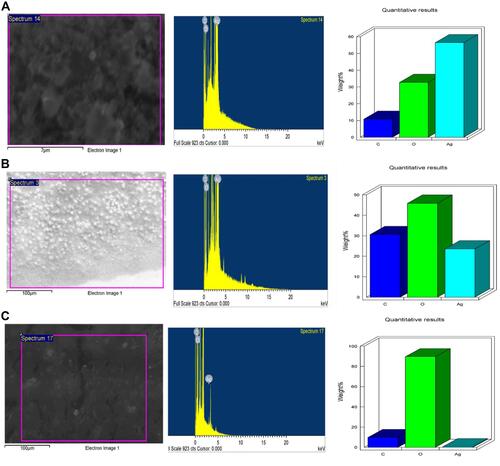
Figure 6 Continued.
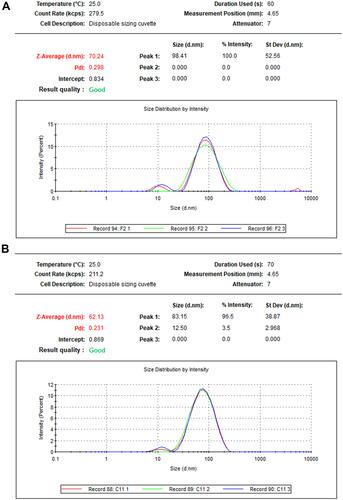
Figure 6 The particle size distribution of P-AgNPs (A), G-AgNPs (B), and C-AgNPs (C).
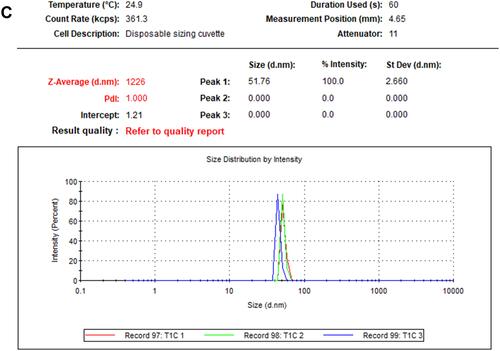
Figure 7 Continued.
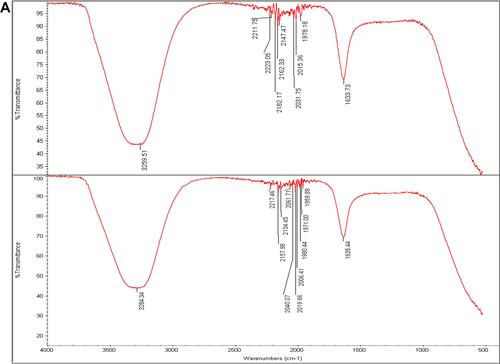
Figure 7 (A) Fourier transform infrared spectroscopy spectrum of Phoma sp. filtrate (above) and that for NPs prepared by their aid, P-AgNPs (below). (B) Fourier transform infrared spectroscopy spectrum of Chaetomium globosum filtrate (above) and that for NPs prepared by their aid, G-AgNPs (below). (C) Fourier transform infrared spectroscopy (FTIR) spectrum fungal filtrate (Chaetomium sp. (above) and that for NPs prepared by their aid, C-AgNPs (below).
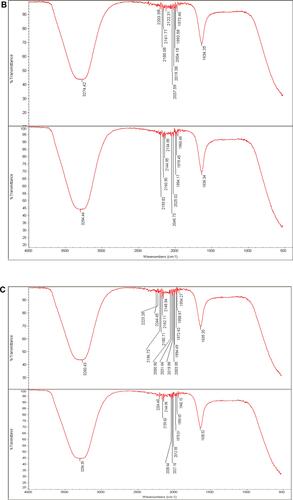
Table 2 Inhibitory Effect (mm) of Fungal-Based NPs Against Some Strains of Pathogenic Bacteria
Figure 8 Antibacterial activity as inhibition zones of P-AgNPs (A), G-AgNPs (B), and C-AgNPs (C). Data presented are mean values from three replicates. * and ** refer to the significant differences between bacteria, p < 0.05 and 0.01, respectively.
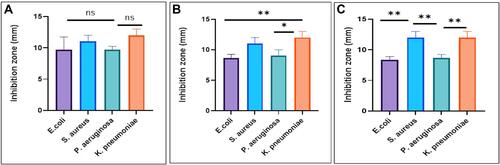
Table 3 MICs and MBCs for the Biogenic AgNPs
Figure 9 SDS-PAGE profile of protein extracted from K. pneumoniae (control) in lane (2) and treated bacteria with P-AgNPs, G-AgNPs, and C-AgNPs in lanes 3, 4, and 5 respectively.
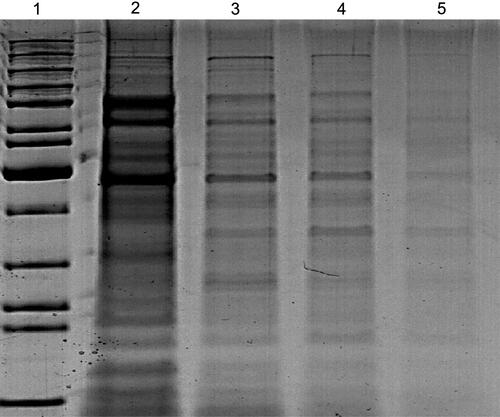
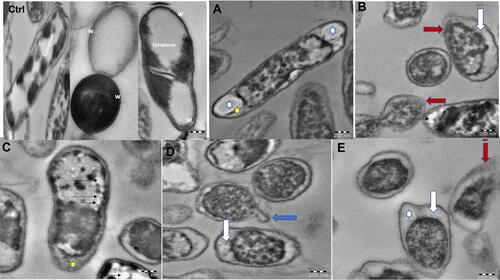
Figure 10 TEM micrographs of K. pneumoniae untreated cells showed reserved morphology where the cell wall (w), cytoplasmic membrane (M), and cytoplasm were clearly intact (Ctrl). Bacteria treated with G-AgNPs showed cell membrane blebbing (blue arrow; D), separation of cytoplasmic membrane from bacterial cell wall (white arrow; B, D, and E), and rupture in the outer membrane (red arrow; B and E). Elongated cell displaying reduction in the cytoplasmic material (white star; A and E), and existence of membrane components (yellow star; A and C). Furthermore, electron-lucent space with different sizes and shapes in the cytoplasm (black thin arrows; C).
Data Availability
The obtained nucleotide sequences of all three fungal isolates were deposited at GenBank with specific accession numbers ().
Table 1 Isolated Fungi from Different Locations in Saudi Arabia