Figures & data
Table 1 Physicochemical Properties of LEU Acetate
Table 2 Physicochemical Properties of Different Degree of Saturation of C18 Fatty Acids Selected for LEU Conjugation
Figure 1 Schematic diagram for the hydroxyl group targeted LEU-oleic acid conjugate (LOC).
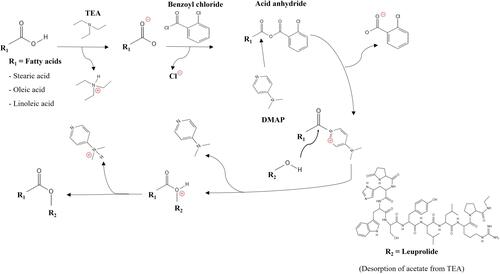
Table 3 Composition Gradients of Prep-HPLC
Figure 2 1H-NMR spectra of LEU, fatty acids and LEU-fatty acid conjugate having different saturation levels: (A) LEU acetate, (B) Stearic acid, (C) Oleic acid, (D) Linoleic acid, (E) LSC, (F) LOC, (G) LLC.
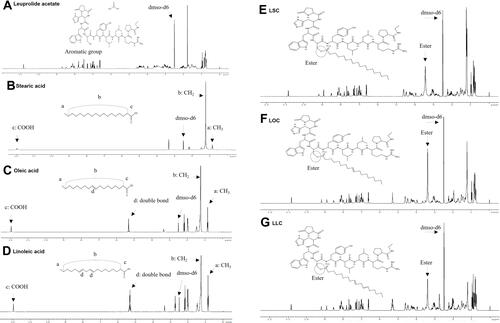
Figure 3 MALDI-TOF results of LEU-fatty acid conjugate after purification by Prep-HPLC: (A) LSC, (B) LOC, (C) LLC.
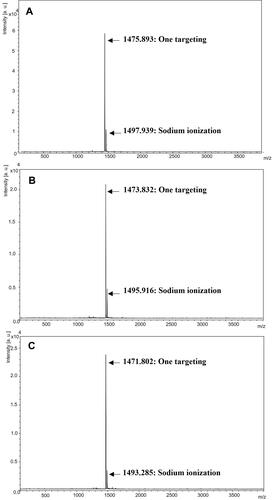
Figure 4 FT-IR spectra of LEU acetate, fatty acids, physical mixtures, and LEU-fatty acid conjugate having different saturation levels (LSC, LOC, LLC).
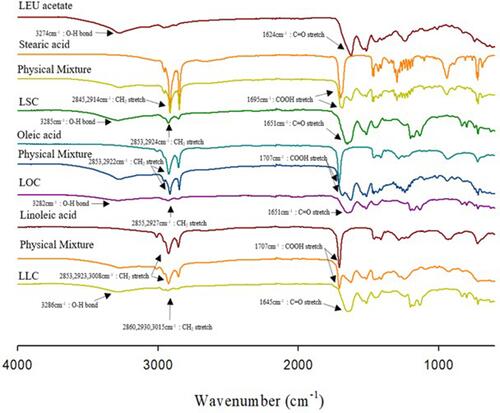
Figure 5 DSC thermograms of LEU acetate, fatty acids, physical mixtures, and LEU-fatty acid conjugate having different saturation levels: (A) LSC, (B) LOC, (C) LLC.
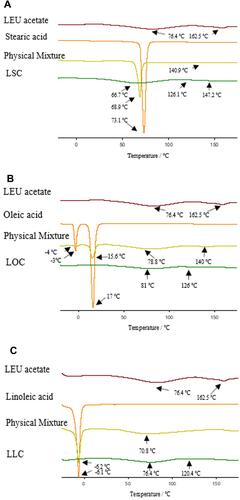
Table 4 Physicochemical Properties of Self-Assembled L18FNs
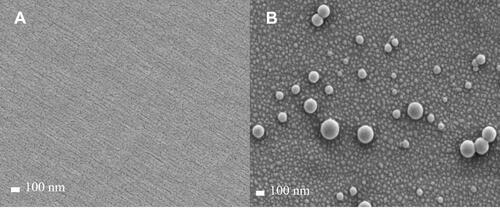
Figure 6 FE-SEM images of LEU acetate and self-assembled L18FNs: (A) LEU acetate, (B) LSN, (C) LON, (D) LLN.
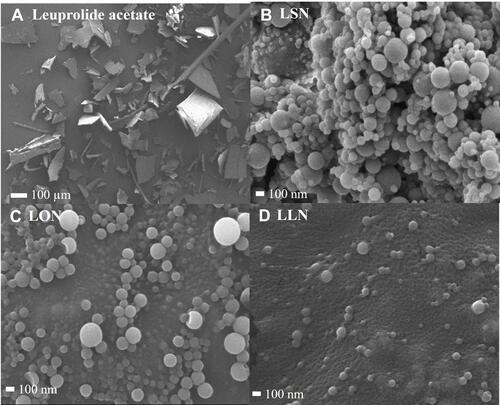
Figure 7 FE-TEM images of self-assembled L18FNs: (A) LSN, (B) LON, (C) LLN.
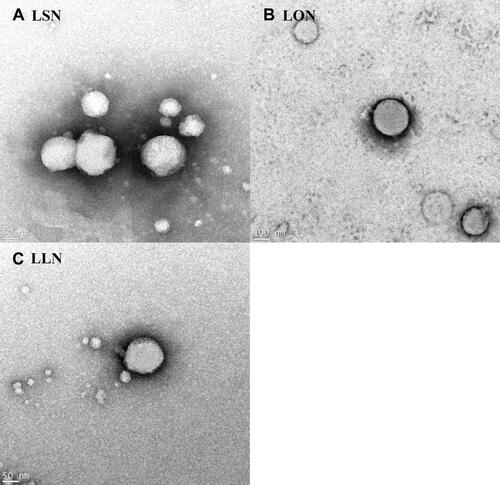
Figure 8 Degradation profiles of LEU (A) and L18FCs (B), and conversion profiles from L18FCs to cumulative LEU concentration (C) in human plasma (n=3).
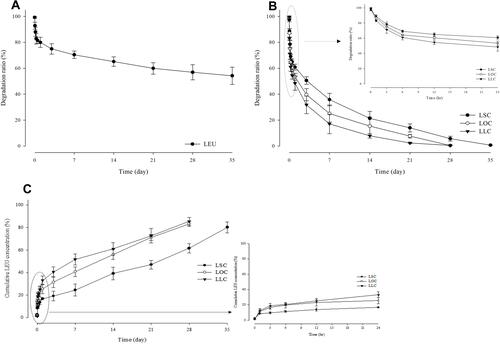
Figure 9 Permeability profile of LEU (A) and L18FNs (B) as a function of time in pH 7.4 PBS through permeation barrier-membrane (PB-M) using Franz diffusion cell (n=3).
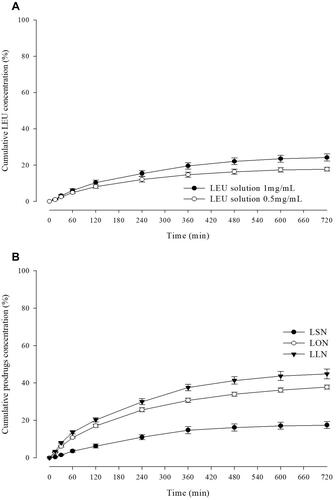
Figure 10 FE-SEM images of the PB-M surface (A), and 120 min after starting LON permeation (B).