Figures & data
Figure 1 (A) UV–Vis spectra of AgNPs synthesized by LLJ at different Ag+ concentrations; (B) Silver ion conversion rate of AgNPs synthesized by LLJ at different Ag+ concentrations; (C) UV–Vis spectra of AgNPs synthesized by LLJ at different pH; (D) Silver ion conversion rate of AgNPs synthesized by LLJ at different pH; (E) UV–Vis spectra of AgNPs synthesized by LLJ at different temperatures; (F) Ag conversion rate of AgNPs synthesized by LLJ at different temperatures.
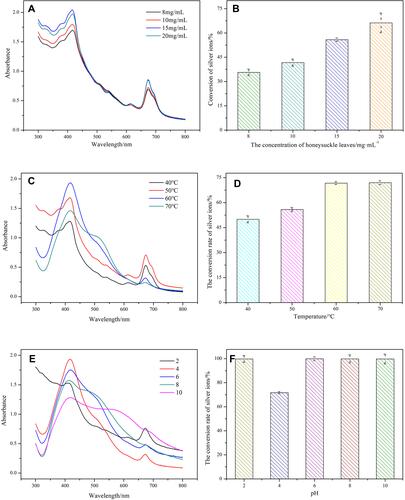
Figure 2 (A) SEM image of AgNPs synthesized by LLJ; (B) TEM image of AgNPs synthesized by LLJ; (C) FTIR image of AgNPs synthesized by LLJ; (D) XRD pattern of AgNPs synthesized by LLJ; (E) XPS pattern of AgNPs synthesized by LLJ.
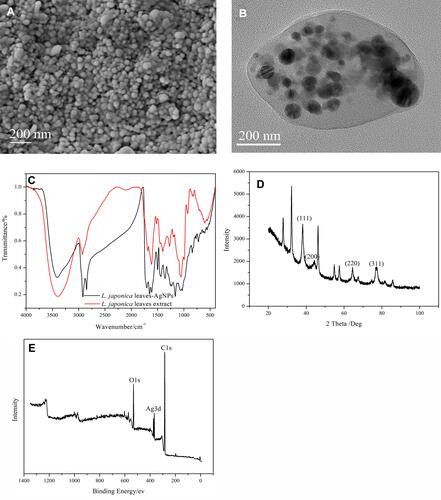
Figure 3 Comparison of free radical DPPH clearance rate between AgNPs, LLJ, and BHT.
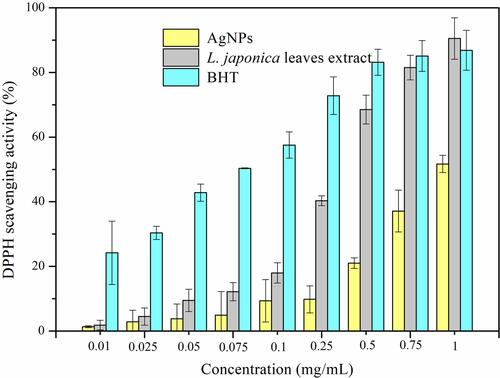
Figure 4 Amount of viable bacteria of culture medium. (A) E. coli; (B) E. coli treated with 0.1 mg/mL LLJ; (C) E. coli treated with 0.1 mg/mL AgNPs; (D) E. coli treated with 0.1 mg/mL tetracycline; (E) Salmonella; (F) Salmonella treated with 0.1 mg/mL LLJ; (G) Salmonella treated with 0.1 mg/mL AgNPs; (H) Salmonella treated with 0.1 mg/mL tetracycline.
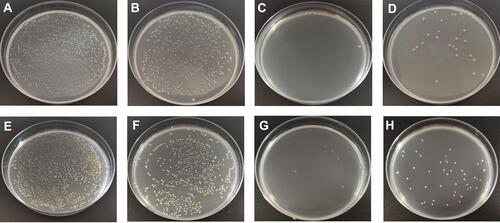
Figure 5 The inhibition rate curves of different samples to bacteria. (A). E. coli; (B). Salmonella.
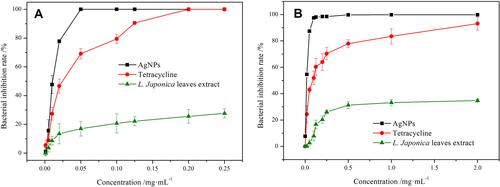
Figure 6 SEM images of bacterial morphology. (A) E. coli; (B) E. coli with LLJ; (C) E. coli with AgNPs; (D) E. coli with tetracycline; (E) Salmonella; (F) Salmonella with LLJ; (G) Salmonella with AgNPs; (H) Salmonella with tetracycline.
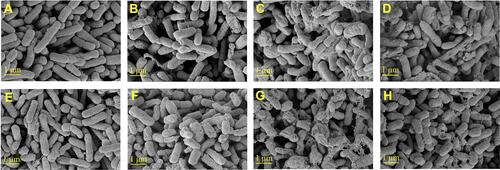
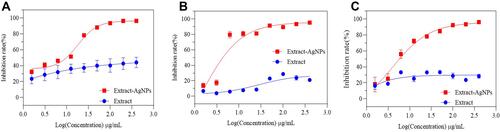
Figure 7 The inhibition rate curves of AgNPs to different cancer cell lines. (A) Hela; (B) HepG2; (C) MDA-MB-231.