Figures & data
Figure 1 Schematic illustration of the construction of the bionic system and the process of targeting thrombi.
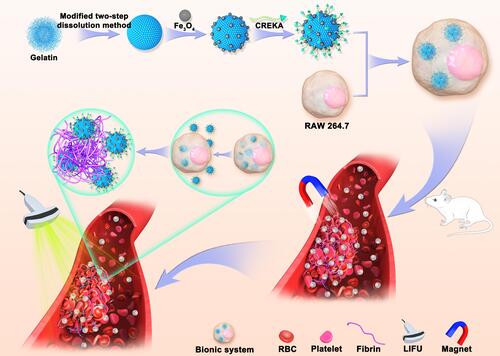
Figure 2 Schematic diagram of the extracorporeal circulation device.
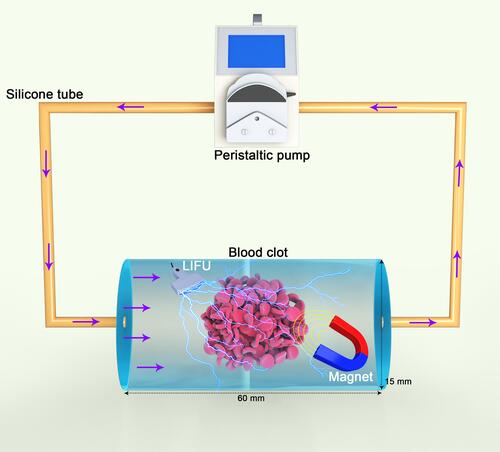
Table 1 Characteristics of Different NPs (n = 3)
Figure 3 NP characterization. (A) TEM image of GNPs (scale bars: 500 nm, scale bar for enlarged TEM: 100 nm). (B) Optical microscopy image of TNPs (scale bar: 1 μm). (C) TEM image of TNPs (scale bar: 200 nm, scale bar for enlarged TEM: 100 nm). (D) SEM image of TNPs (scale bar: 200 nm). (E) Fe3O4 loading rates of NTNPs and TNPs. (F) Flow cytometry results showing the CREKA carrier rate in TNPs. (G) FTIR results of NTNPs and TNPs. (H) Results of CREKA conjugation onto TNP surfaces under CLSM (scale bar: 1 μm). Diameter (I) and zeta potential (J) changes of GNPs and TNPs in deionized water over 8 days. Diameter (K) and zeta potential (L) changes of GNPs and TNPs in solutions of different pH on day 7.
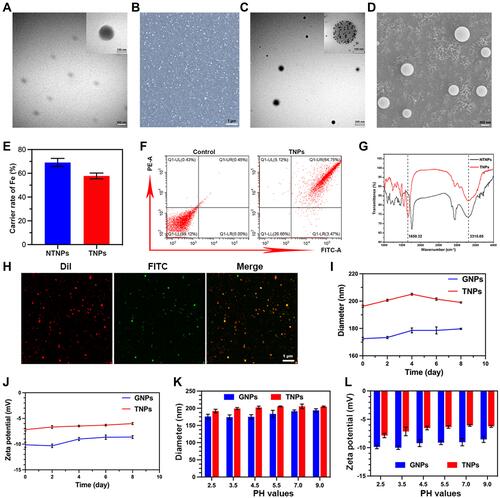
Figure 4 Cytotoxicity of different kinds of NPs to RAW 264.7 cells. (A) Cell viability of RAW 264.7 cells incubated with different NPs for 24 h. (B) Apoptosis results of RAW 264.7 cells incubated with different NPs for 24 h by flow cytometry.
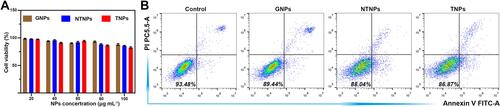
Figure 5 Construction of the bionic system. CLSM results of the phagocytosis of NPs by LPS-activated RAW 264.7 (A) or nonactivated RAW 264.7 (B) cells at different times (scale bar: 50 μm). (C) Flow cytometry results of phagocytosis of NPs by macrophages at different times. (D) TEM images of RAW 264.7 cells, MNTNPs and MTNPs; the red arrows represent the NPs engulfed by RAW 264.7 cells (scale bar: 2 μm, scale bar for enlarged TEM: 1 μm).
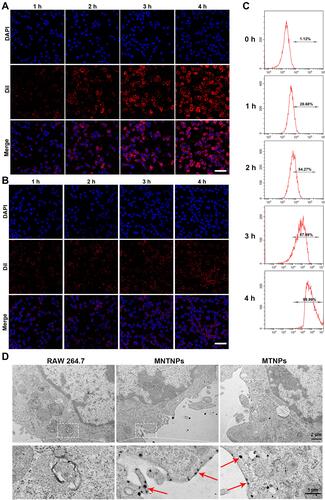
Figure 6 Effects of LIFU irradiation on the bionic system. (A) CLSM images of RAW 264.7 cells stained with CAM and PI after LIFU irradiation at 0, 1, 2, 3, and 4 W/cm2 for 10 min (scale bar: 50 μm). (B) Change curve of temperature with MTNPs irradiated with LIFU at different intensities (1, 2, 3, 4 W/cmCitation2) for 10 min. (C) TEM image of NPs released by LIFU irradiation of MTNPs (scale bar: 200 nm, scale bar for enlarged TEM: 100 nm). (D) TEM image of cells treated with LIFU irradiation of MTNPs (scale bar: 2 μm). (E) CLSM images of NPs released by LIFU irradiation of MTNPs (scale bar: 1 μm).
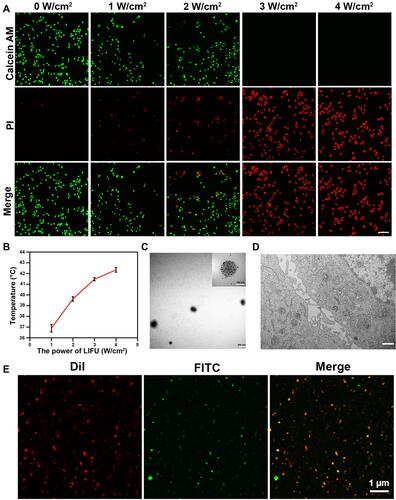
Figure 7 Thrombus-targeting performance of the bionic system. (A) Images of the cell migration assay in the groups treated with MTNPs, MTNPs + IL-1 and MTNPs + IL-1 + magnet (scale bar: 50 μm). (B) Quantitative analysis of migrated cells in the groups treated with MTNPs, MTNPs + IL-1 and MTNPs +IL-1 + magnet (****P<0.0001). (C) CLSM images of frozen thrombus slices incubated with the indicated groups in an extracorporeal circulation device (# the thrombus samples were previously treated with excess free CREKA peptides; scale bar: 100 μm). (D) Average fluorescence intensity analysis of CLSM images in the groups treated with NTNPs, TNPs, MTNPs, TNPs + magnet, MTNPs + magnet + LIFU, and MTNPs + magnet + LIFU# (# the thrombus samples were previously treated with excess free CREKA peptides, *P<0.05, ****P<0.0001, ns = no significance). (E) Pathological images of carotid artery thrombus segments from the indicated groups after H&E staining; the red arrows indicate the NPs (# before treatment, 0.5 mL of hydrated free CREKA peptides (10 mg/mL) injected into the tail vein of rats; scale bar: 200 μm, scale bar for enlarged pathological images: 40 μm).
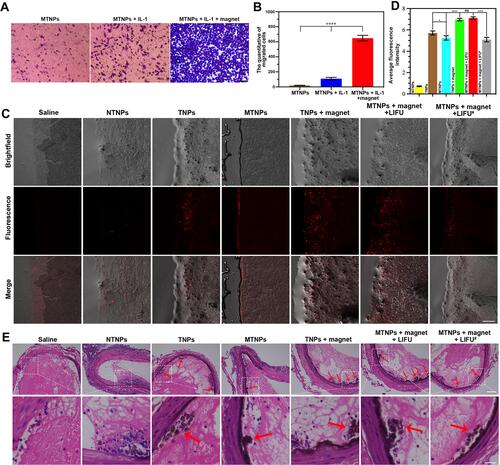
Figure 8 MR images in vitro and in vivo. MR-T2WI images (A) and 1/T2 (B) of NTNPs and TNPs with different Fe concentrations (0.06, 0.07, 0.09, 0.13, 0.22, and 0.35 mM, from left to right). (C) MR-T2WI images of thrombi at 0, 15, 30, 45, and 60 min after injection of NTNPs, TNPs (with or without magnet), MTNPs (with or without magnet + LIFU). The thrombus is shown in the red circle. (D) MR-T2WI images of the abdomen after injection of MTNPs and TNPs. (E) SNR curves of the liver, spleen, and kidney before and after injection of TNPs and MTNPs at 0 min, 10 min, 20 min, 30 min, 60 min, 2 h and 4 h.
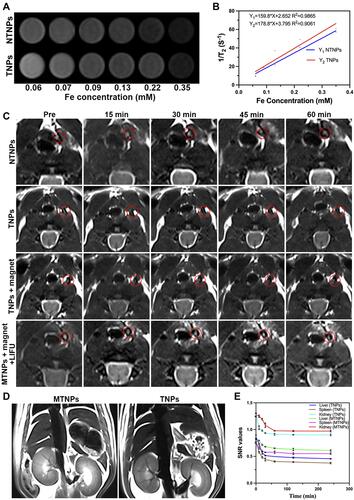
Figure 9 Fluorescence images in vitro and in vivo and biodistribution. (A) Fluorescence images and average fluorescence intensity values of TNPs at different concentrations in vitro. (B) Fluorescence images of the left carotid artery before and after injections of TNPs and MTNPs (with magnetic navigation and LIFU irradiation; the thrombus segment of the left carotid artery is shown in the red circle in each image) at different time points. (C) Quantitative analysis of the fluorescence intensity values of the left carotid artery regions at different time points (**P <0.01, ***P <0.001, ****P <0.0001). (D) Ex vivo fluorescence intensity images of the left carotid artery and major organs (heart, liver, spleen, lung, kidney) of the groups treated with TNPs and MTNPs (with magnetic navigation and LIFU irradiation). (E) Quantitative analysis of the fluorescence intensity values of ex vivo tissue and major organs for the groups treated with TNPs and MTNPs (with magnetic navigation and LIFU irradiation) (*P<0.05, ****P <0.0001).
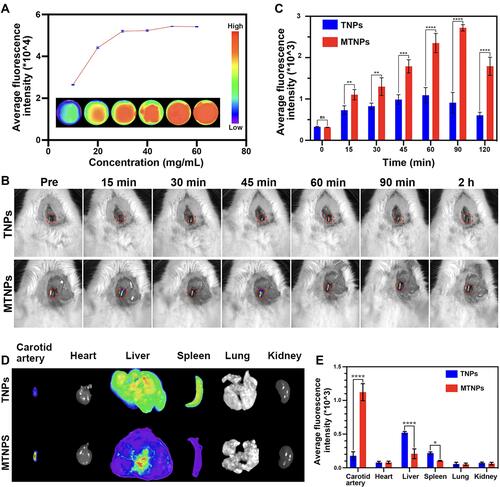
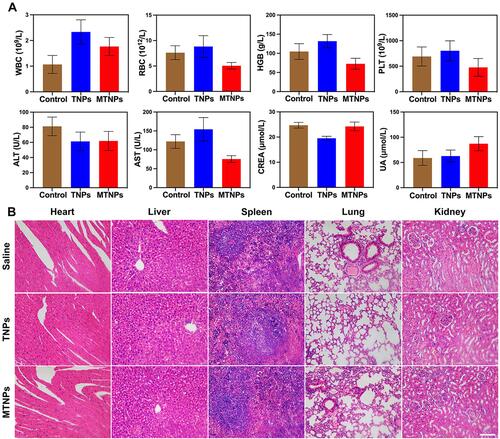
Figure 10 In vivo biocompatibility evaluation. (A) In vivo complete blood count and biochemical detection 3 h after injection of the indicated treatment groups. (B) H&E staining of major organs (heart, liver, spleen, lung and kidney) 24 h after injection of the indicated treatments (scale bar: 100 μm).