Figures & data
Table 1 Composition and Characteristics of the Prepared 3D-Printed Polypills
Table 2 Pharmacokinetic Parameters of GMD After Oral Administration of 10 mg/kg in Rats (n = 6, the Data Expressed as Mean ± SD)
Figure 1 Plasma concentration-time curves for (A) GMD and (B) RSV after oral administration of the 3D-printed polypills to induced-hyperglycemic/dyslipidemic male Wistar rats. #Indicates significant difference between SNEDDS-loaded GMD 3D-P pills and non-SNEDDS-loaded 3D-P pills. $Indicates significant difference between SNEDDS-loaded GMD/RSV 3D-P pills and non-SNEDDS-loaded 3D-P pills. A significant difference was considered at P < 0.05. Data are presented as mean ± SD, (n = 6).
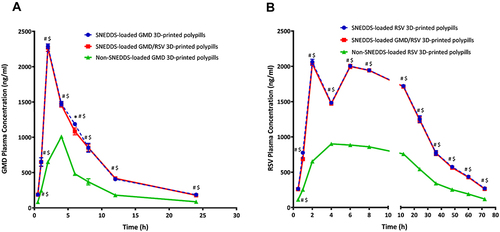
Table 3 Pharmacokinetic Parameters of RSV After Oral Administration of 20 mg/kg in Rats (n = 6, the Data Expressed as Mean ± SD)
Figure 2 (A) Blood glucose level and (B) the percentage of inhibition of blood glucose level after oral administration of the 3D-printed polypills to induced-hyperglycemic/dyslipidemic male Wistar rats.
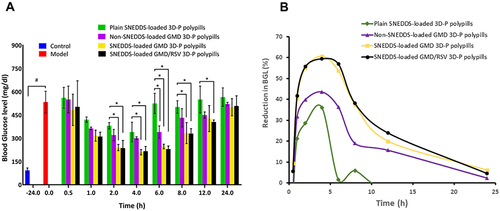
Figure 3 Serum lipid profile in induced-hyperglycemic/dyslipidemic male Wistar rats after oral treatment with a single dose of the prepared 3D-printed polypills. (A) Levels of total cholesterol; (B) levels of triglycerides; (C) LDL levels and (D) HDL levels.
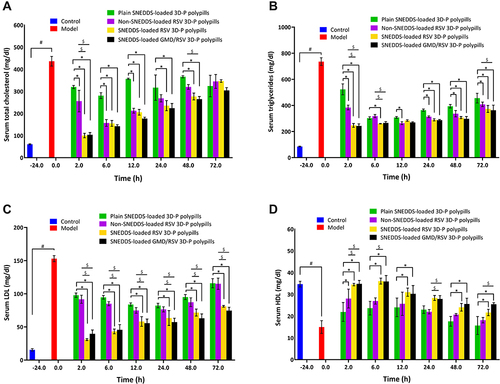
Figure 4 Atherosclerosis index of induced hyperglycemic/dyslipidemic male Wistar rats after oral administration of a single dose of the prepared 3D-printed polypills.
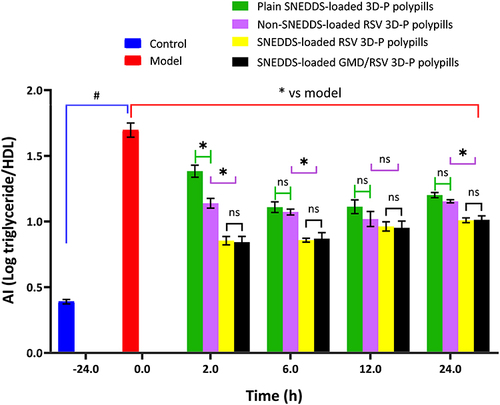
Figure 5 Serum liver enzymes (A) levels of ALT, (B) levels of AST and (C) levels of ALP of induced-hyperglycemic/dyslipidemic male Wistar rats after oral treatment with a single dose of the prepared 3D-printed polypills.
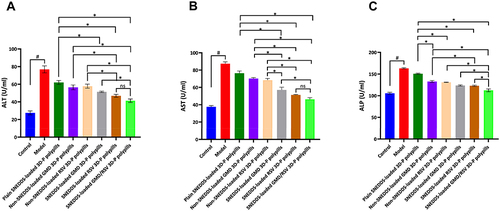
Figure 6 Antioxidant enzymes of induced-hyperglycemic/dyslipidemic male Wistar rats after oral treatment with a single dose of the prepared 3D-printed polypills. Serum levels of (A) CAT, (B) SOD, and (C) GST.
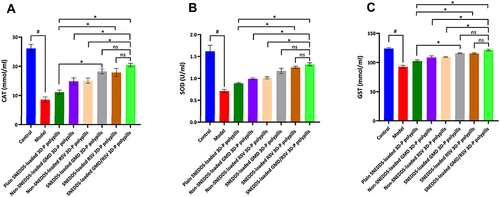
Figure 7 Histopathological images of the pancreas cells. Photomicrograph for the pancreas of the control group showing normal islets of Langerhans (A). Photomicrograph for the pancreas of the model group showing necrosis of islets of Langerhans admixed with an accumulation of eosinophilic tissue debris “black arrow” (B). Photomicrograph for the pancreas of plain SNEDDS-loaded 3D-P pills showing average-sized islets of Langerhans with few vacuolated cells (arrow) and few necrotic debris (C). Photomicrograph for the pancreas of non-SNEDDS-loaded GMD 3D-P pills showing vacuolation in the islets cells (D). Photomicrograph for the pancreas of non-SNEDDS-loaded RSV 3D-P pills showing marked vacuolation of islets cells with reduction of islets size (E). Photomicrograph for the pancreas of SNEDDS-loaded GMD 3D-P pills showing atrophy of pancreatic islet with vacuolation and mild congested blood vessel (F). Photomicrograph for the pancreas of SNEDDS-loaded RSV 3D-P pills showing mild atrophy of pancreatic islets (G). Photomicrograph for the pancreas of SNEDDS-loaded GMD/RSV 3D-P polypills showing apparently normal pancreatic islet (H).
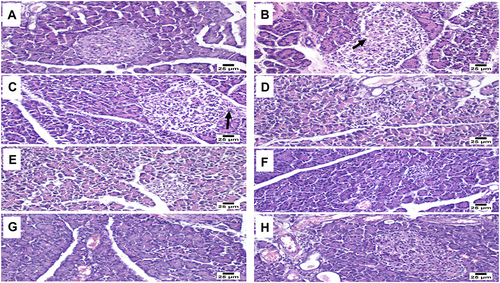
Figure 8 Area of islets of Langerhans in different groups.
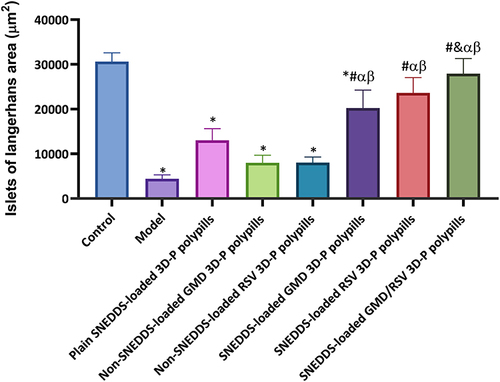
Figure 9 Histopathological images of the liver cells. Liver tissue from the control group showing normal histological structure (A). Liver tissue from the model group showing diffuse steatosis of the hepatic parenchyma (B). Liver tissue from plain-SNEDDS-loaded 3D-P polypills showing steatosis of hepatocytes (C). Liver tissue from non-SNEDDS-loaded GMD 3D-P polypills showing hemorrhages and steatosis of the hepatic parenchyma (D). Liver tissue from non-SNEDDS-loaded RSV 3D-P polypills showing widespread micro and macrovesicular steatosis in the hepatic parenchyma (E). Liver tissue from SNEDDS-loaded GMD 3D-P polypills showing apparently normal hepatocytes (F). Liver tissue from SNEDDS-loaded RSV 3D-P polypills showing mild dilation of hepatic sinusoids (G). Liver tissue from SNEDDS-loaded GMD/RSV 3D-P polypills showing apparently normal hepatic parenchyma (H).
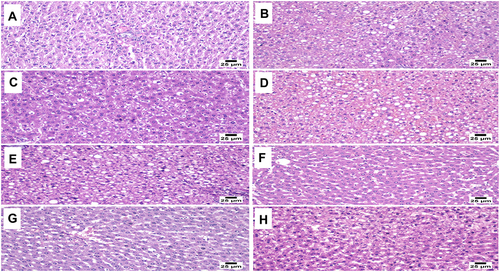
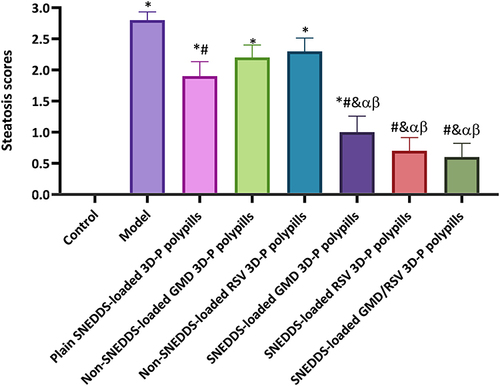
Figure 10 Liver steatosis lesion scores in different groups. Values were expressed as means ± SE.