Figures & data
Figure 1 Construction and expression of DC-binding peptide-fused Cap proteins.
Notes: (A) The construction schematic of recombinant expression vector. Amino acid sequences corresponding to different DC-binding peptides (DCbps) were inserted into C terminal of Cap. The expression of fusion sequence was under the control of T7 promoter. SDS-PAGE (B) and Western blots (C) of recombinant proteins expression. 8C3: mouse anti-Cap MAb.
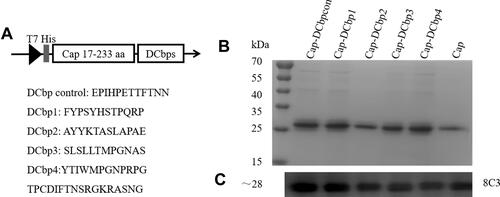
Table 1 The Primer Sequences used for detecting marker genes and cytokine expression in BM-DCs
Table 2 The Primer Sequences used for detecting Cytokine production by splenocytes
Figure 2 Physicochemical characterization of Cap-DCbp VLPs.
Notes: (A) Morphological characterization of Cap-DCbp VLPs under a TEM (×25,000). (B) Particle diameter determination of Cap-DCbp VLPs by DLS. (C) Morphological detection of Cap-DCbp VLPs after storage under a TEM (×25,000).
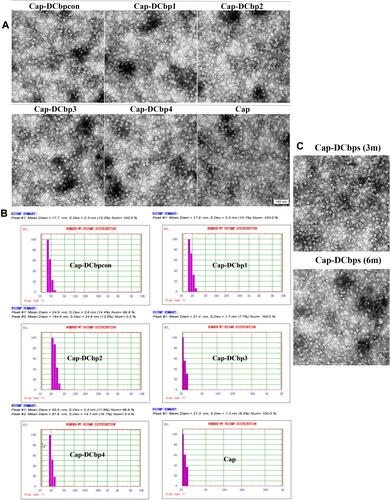
Table 3 Storage Efficiency of Cap VLPs
Figure 3 DC-binding peptides enhanced uptake of Cap VLPs in BM-DCs.
Notes: (A) Differentiated BM-DCs. Suspensions of bone marrow were cultured with GM-CSF and IL-4. (B) Cap internalization. BM-DCs were incubated with Cap VLPs or medium. Primary antibody: mouse 8C3 mAb; secondary antibody: FITC-coupled goat anti-mouse IgG. Signals of cell nuclei (blue) and Cap (green) were detected by CLSM.
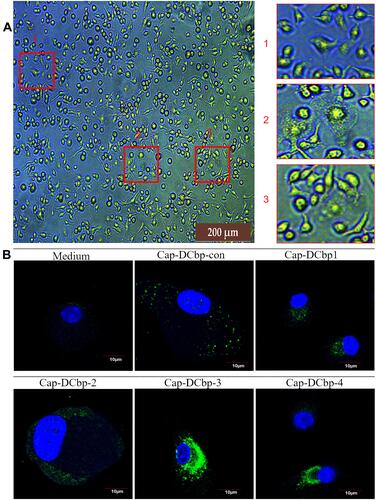
Figure 4 Assessment of antigen uptake and immunostimulatory effects in BM-DCs.
Notes: BMDCs were exposed to 100 μg/mL antigens for 12 h. MHC-II (A), CD80 (B), CD86 (C) and IL-6 (D) were then investigated by qPCR. (*p<0.05, **p<0.01,***p<0.001).
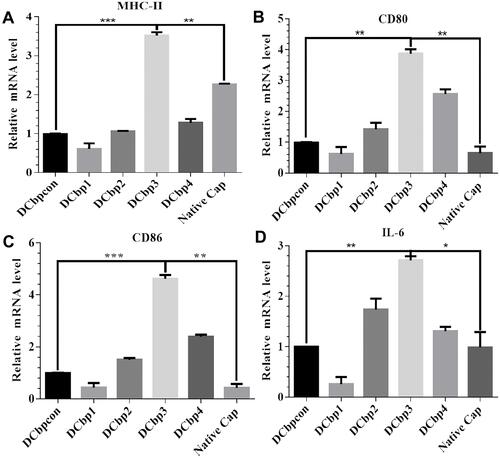
Figure 5 Detection of Cap-specific antibodies in sera.
Notes: Specific antibodies including IgG, IgG1 and IgG2a against Cap were measured in serum samples by ELISA at 35 dpi (A) and 42 dpi (B). (*p<0.05; **p<0.01; ***p<0.001).
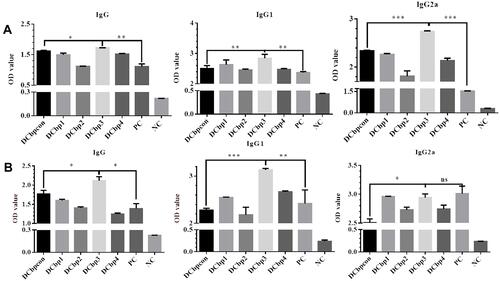
Figure 6 Detection of PCV2-specific NAbs in sera.
Notes: Neutralizing antibodies against PCV2 JH strain were measured in serum samples at 42 dpi. NAb titers were calculated and expressed as the log2 of the reciprocal of the highest serum dilution that was able to completely block PCV2-infection in PK-15 cells. (*p<0.05, **p<0.01).
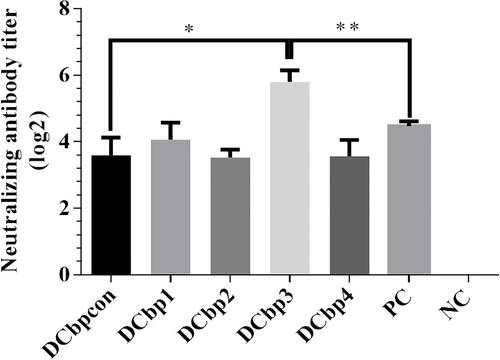
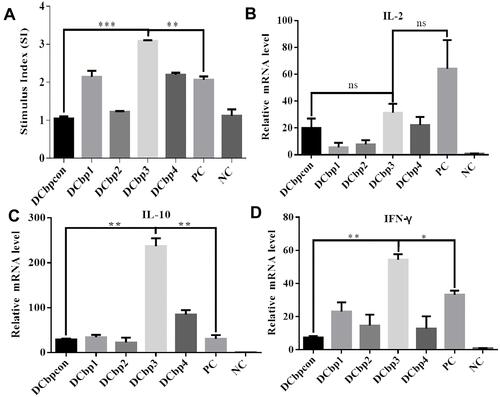
Figure 7 Lymphocyte proliferation and cytokine induction in response to specific antigen.
Notes: (A) Results of lymphocyte proliferation. Plates were incubated with 10 μg/mL Cap for 36 h before their proliferation stimulation index (SI) was evaluated by CCK8 method. Relative mRNA fold changes of IL-2 (B), IL-10 (C) and IFN-γ (D) were detected by qPCR. (*p<0.05; **p<0.01; ***p<0.001, p>0.05).
Abbreviation: ns, not significant.