Figures & data
Figure 1 X-ray diffraction patterns for (A) pure iron oxide nanoparticles and (B) iron oxide nanoparticles coated with chitosan and gallic acid.
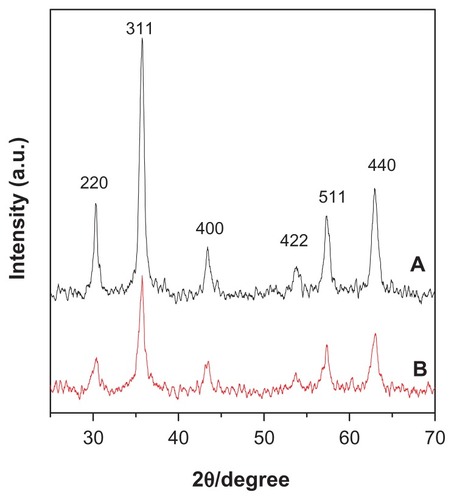
Figure 2 Fourier transform infrared spectra of (A) iron oxide nanoparticles, (B) iron oxide nanoparticles coated with chitosan, and (C) iron oxide nanoparticles coated with chitosan and gallic acid.
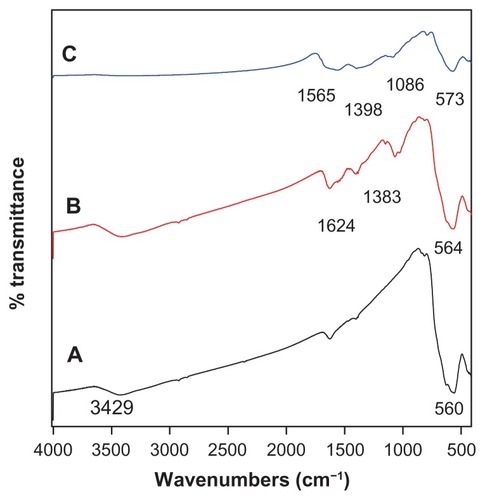
Table 1 Magnetic properties of Fe3O4 magnetic nanoparticles and FCG
Figure 3 Magnetization plots of (A) iron oxide magnetic nanoparticles and (B) iron oxide nanoparticles coated with chitosan and gallic acid.
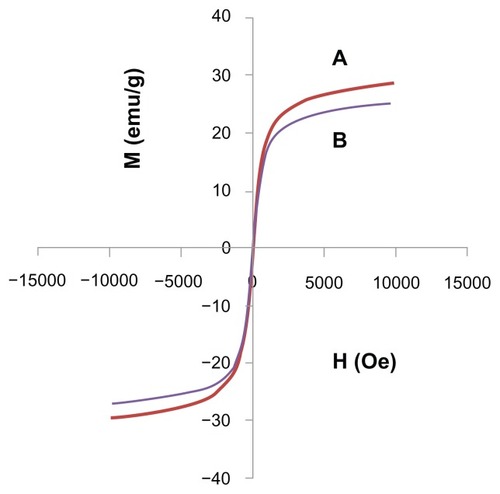
Figure 4 Thermogravimetric analysis of (A) gallic acid and (B) iron oxide nanoparticles coated with chitosan and gallic acid.
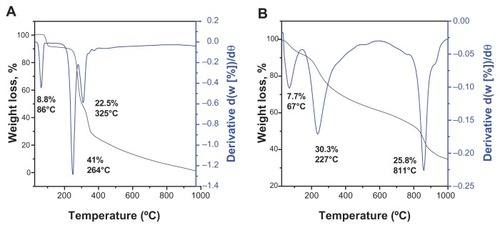
Figure 5 Field emission scanning electron microscopy images of (A) iron oxide magnetic nanoparticles at 50,000× magnifications, (B) iron oxide nanoparticles at 240,000× magnification, (C) iron oxide nanoparticles coated with chitosan and gallic acid at 150,000× magnification, and (D) iron oxide nanoparticles coated with chitosan and gallic acid at 300,000× magnification.
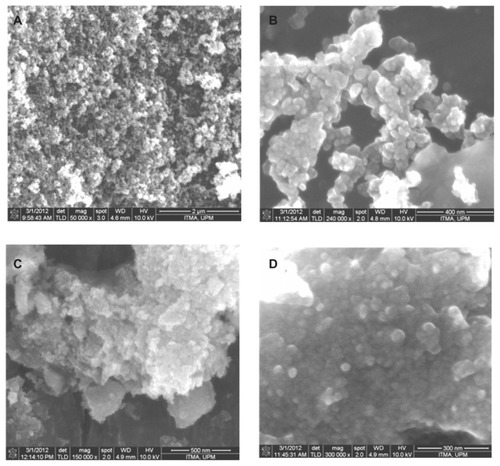
Figure 6 Transmission electron micrographs (A) for iron oxide magnetic nanoparticles with 500 nm bar, (B) iron oxide nanoparticles coated with chitosan and gallic acid with 100 nm magnetic bar, (C) particle diameter of iron oxide nanoparticles, and (D) particle diameter of iron oxide nanoparticles coated with chitosan and gallic acid.
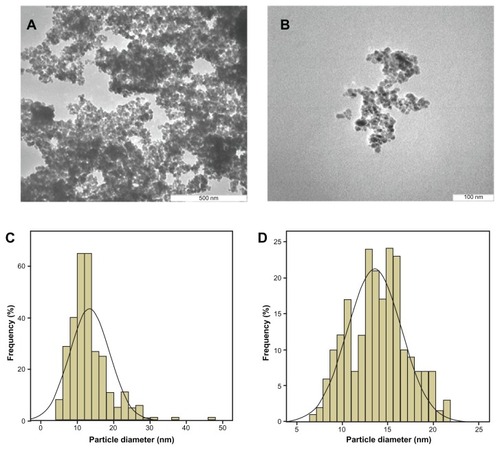
Figure 7 Release profiles of gallic acid from the iron oxide nanoparticles coated with chitosan and gallic acid into (A) aqueous solution of 0.0001 M Na2CO3, (B) phosphate-buffered solution at pH 4.8, and (C) at pH 7.4.
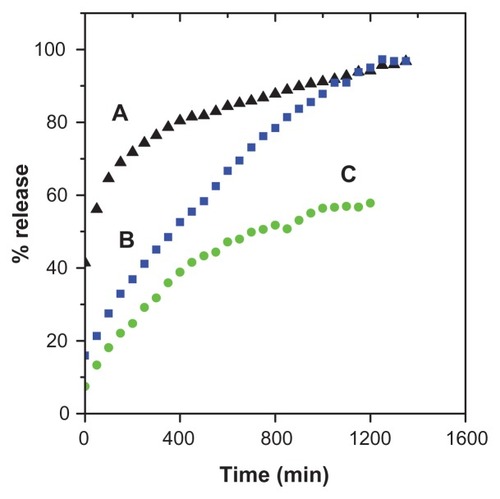
Table 2 Correlation coefficient (R2), rate constant (k), and half-time (t1/2) obtained by fitting the data of the release of gallic acid from FCG into 0.0001 M Na2CO3 and in phosphate-buffered solution at pH 7.4 and 4.8
Figure 8 Fitting graphs for gallic acid release from iron oxide nanoparticles coated with chitosan and gallic acid, into different solutions to the first-order and pseudosecond order kinetics, and the parabolic equation for 0.0001 M Na2CO3 (A–C), pH 7.4 (D–F), and pH 4.8 (G–I).
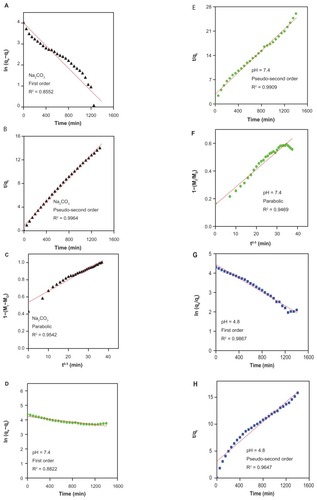
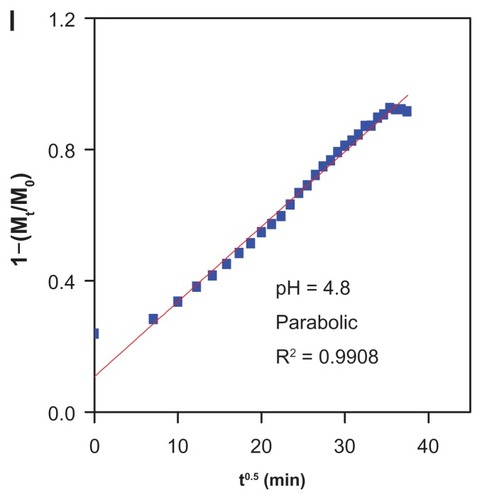
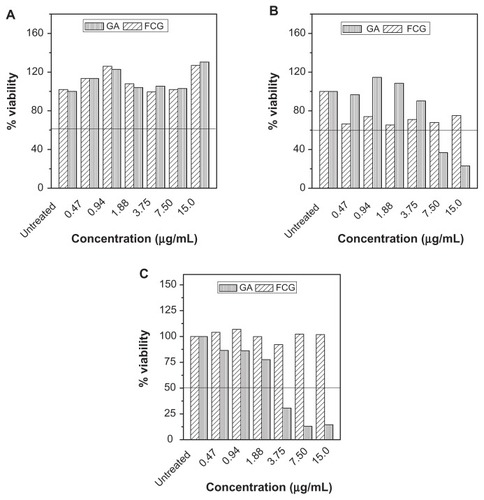
Figure 9 MTT assays of (A) normal human fibroblast (3T3) cell line, and anticancer activity in (B) MCF7, and (C) HT29 cell lines after 72 hours of treatment with gallic acid and iron oxide nanoparticles coated with chitosan and gallic acid at different concentrations.