Figures & data
Table 1 Comparison Between Optical Imaging Technologies and Traditional Clinical Imaging Modalities in Clinical Application of Tumor Disease
Table 2 Comparison Between Optical Therapy Modalities and Traditional Clinical Treatments in Clinical Application of Tumor Disease
Figure 1 Schematic illustration of multi-modal optical imaging and combined phototherapy of nasopharyngeal carcinoma based on a nanoplatform.
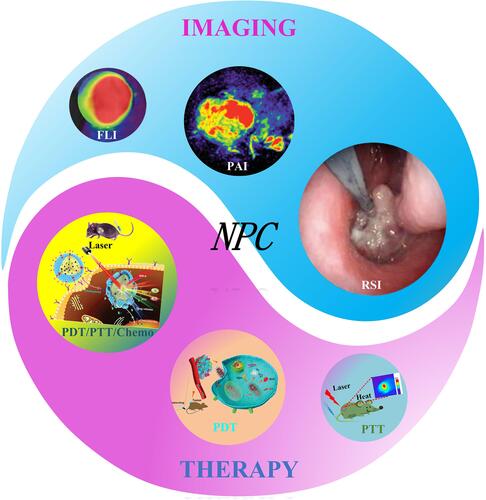
Figure 2 Tumor’s imaging in model mice by using fluorescence-labelled affibody molecules. Tumor-bearing nude mice (arrows) were generated with cell lines CNE-2Z (A), and A375 (B). NIR-based imaging was performed at different time points p.i. with DyLight 755-labelled ZLMP2A-N affibodies. DyLight 755-labelled ZWT affibody was used as a negative control. Adapted from Zhu J, Kamara S, Cen D et al. Generation of novel affibody molecules targeting the EBV LMP2A N-terminal domain with inhibiting effects on the proliferation of nasopharyngeal carcinoma cells. Cell death \and disease. 2020, 11(4): 1–16. Creative Commons license and disclaimer available from: http://creativecommons.org/licenses/by/4.0/legalcode.Citation38
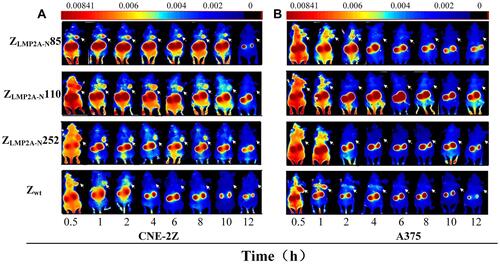
Figure 3 In vivo H2O2-responsive photoacoustic imaging (PAI) for nasopharyngeal carcinoma detection with exosome-like nanozyme vesicles. (A) PAI of the tumor in nude mice before and 2, 4, and 8 h intravenous post injections of nanozyme vesicles. (B) Average photoacoustic signal intensity of the tumor tissues of panel a. Error bars represented the standard deviations (n = 3). **p < 0.01, ***p < 0.001, ****p < 0.0001. Reprinted from Ding H, Cai Y, Gao L et al. Exosome-like nanozyme vesicles for H2O2-responsive catalytic photoacoustic imaging of xenograft nasopharyngeal carcinoma. Nano Lett. 2018, 19(1): 203–209. Copyright (2018) American Chemical Society.Citation43
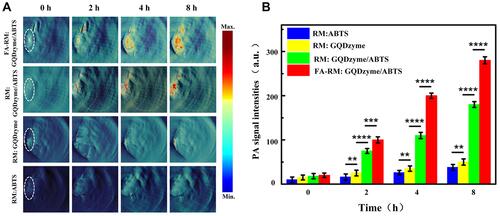
Figure 4 (A) Representative spectra obtained from the LMP1-SERS probe in nasopharyngeal carcinoma (NPC) tissue (red), normal nasopharyngeal tissue (blue), and glass (black), as well as non-targeted surface-enhanced Raman scattering (SERS) probes in the NPC tissue (green). The SERS was acquired by scanning the laser beam to cover the white boxes in (B and C), where black represents the lowest intensity and white represents the highest intensity. Reproduced from with permission from Dove Medical Press Ltd. Chen Y, Zheng X, Chen G et al. Immunoassay for LMP1 in nasopharyngeal tissue based on surface-enhanced Raman scattering. Int J Nanomed. 2012, 7: 73–82.Citation51
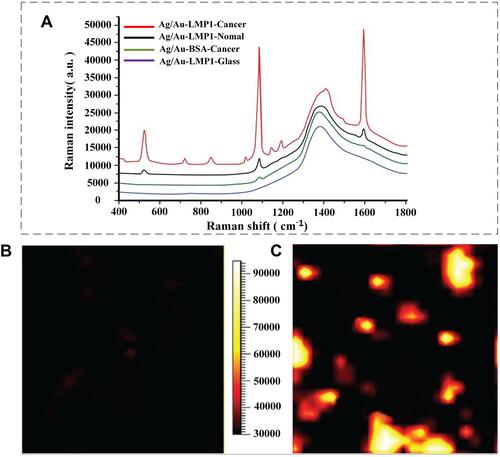
Figure 5 Tail vein injection group (A) and Control group (B), “+” is the highest temperature area which is measured by the NIR imager. (a) Tumor before treatment, (b) Tumor after five treatments, (c) The maximum temperature is 33.8 °C and 34.0 °C (non-tumor tissue temperature) before treatment, (d) The maximum temperature after 10 min of treatment reached 43.7 °C (injection group) and 41.8 °C (Control group) 10 min (tumor tissue temperature). (C) Tail vein injection group and Control group. (The first column was the tumor pre-treatment, and the last column was the tumor after five photothermal therapy (PTT) sessions. Reproduced from Liu Q, Liu L, Mo C et al. Polyethylene glycol-coated ultrasmall superparamagnetic iron oxide nanoparticles-coupled sialyl Lewis X nanotheranostic platform for nasopharyngeal carcinoma imaging and photothermal therapy. J. Nanobiotechnology. 2021, 19(1): 1–14. Creative Commons license and disclaimer available from: http://creativecommons.org/licenses/by/4.0/legalcode.Citation14
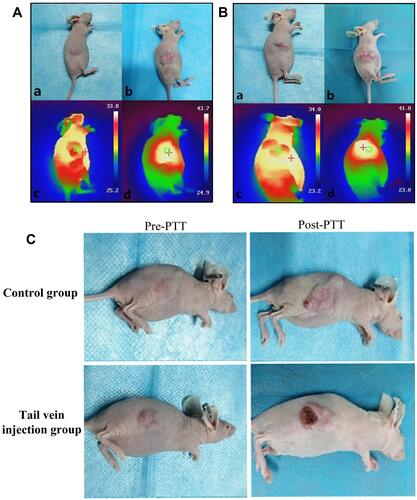
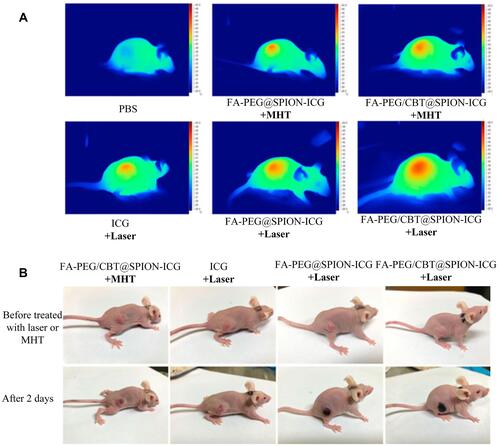
Figure 6 Thermal imaging of the mice after treatment with different formulations with NIR or MHT (A). Imaging was performed before and on day 2 after administering the different treatments (B). Reproduced from Zhong Y, Bejjanki NK, Miao X et al. Synthesis and Photothermal Effects of Intracellular Aggregating Nanodrugs Targeting Nasopharyngeal Carcinoma. Frontiers in bioengineering and biotechnology. 2021: 847. Creative Commons license and disclaimer available from: http://creativecommons.org/licenses/by/4.0/legalcode.Citation85