Figures & data
Scheme 1 Schematic diagram of in situ single-pass intestinal perfusion model. D: Perfusate from duodenum; J: perfusate from jejunum; I: perfusate from ileum; C: perfusate from colon.
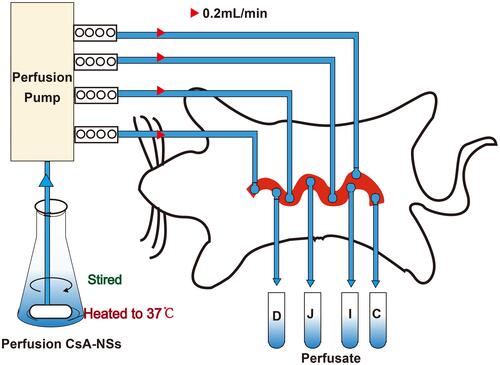
Figure 1 Mean particle size (MPS) and polydispersity index (PDI) as a function of milling time for cyclosporin A, (n = 3).
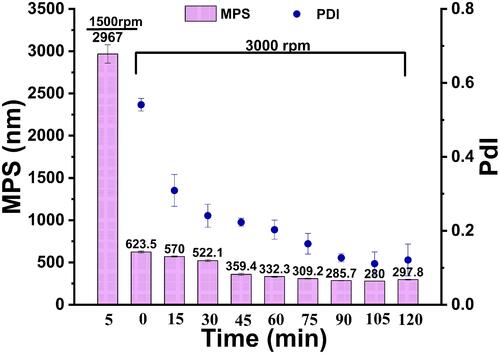
Figure 2 SEM of CsA-NS of 280 nm (A), 522 nm (B), 2967 nm (C). Magnification = 10000 ×.
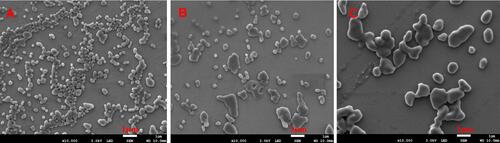
Figure 3 TEM of CsA-NS of 280 nm (A), 522 nm (B), 2967 nm (C). Magnification = 10000 ×.
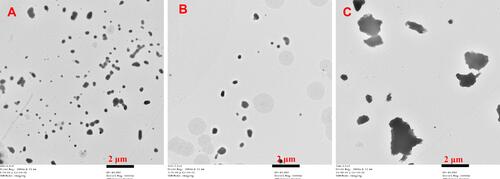
Figure 4 X-ray diffraction patterns of stabilizers, API, physical mixture, 280 nm CsA-NS, 522 nm CsA-NS and 2967 nm CsA-NS.
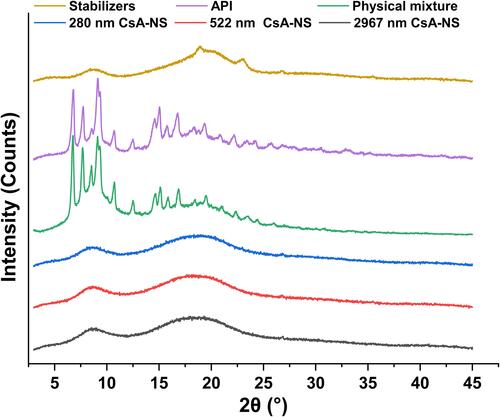
Figure 5 DSC diffraction patterns of stabilizers, API, physical mixture, 280 nm CsA-NS, 522 nm CsA-NS and 2967 nm CsA-NS.
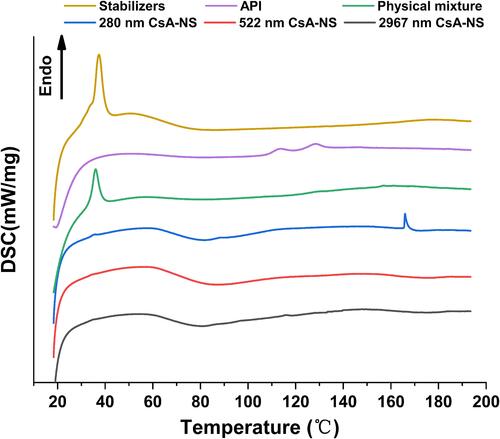
Figure 6 Particle size stability of CsA-NSs in different condition. Initial: 0 day after preparation; 4 ℃: stored at 4 °C for 3 months; RT: stored at room temperature for 3 months; KB: mixed with KB at 37 ℃ for 4 h; SGF: mixed with SGF at 37 ℃ for 2 h; SIF: mixed with SIF at 37 ℃ for 12 h, (n = 3).
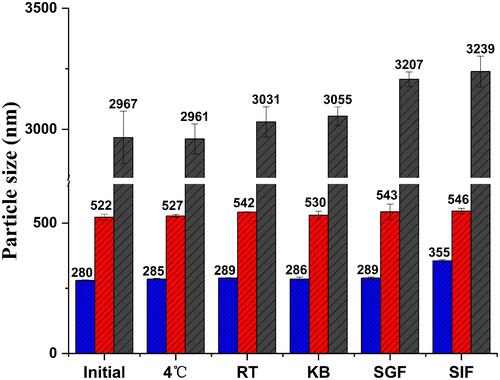
Table 1 Coarse CsA and CsA-NSs Solubility in Water, Hydrochloric Acid pH 1.2, Phosphate Buffer pH 4.5 and Phosphate Buffer pH 6.8 (n = 3, Means ± SD)
Figure 7 In vitro drug release testing of different sized (280 nm, 522 nm, and 2967 nm) nanosuspensions in water (A), pH 1.2, hydrochloric acid (B), pH 4.5, phosphate buffer (C) and pH 6.8, phosphate buffer (D). (USP apparatus II with paddles at 100 rpm, n = 3).
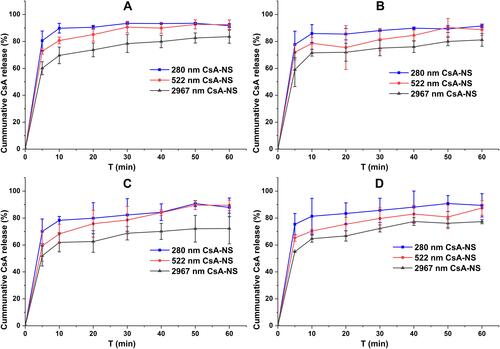
Table 2 Absorption Parameters of CsA-NSs with Different Size in Rat Intestine at a Dose of 40 µg/mL (n = 3, Means ± SD)
Scheme 2 Schematic diagram about transport of CsA-NSs in rat small intestine.
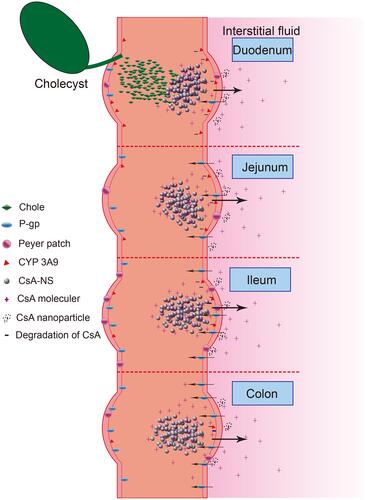
Table 3 Pharmacokinetic Parameters of Neoral® and Different Sized CsA-NSs at a Dose of 25 mg/kg in SD Rats (n = 6, Means ± s)
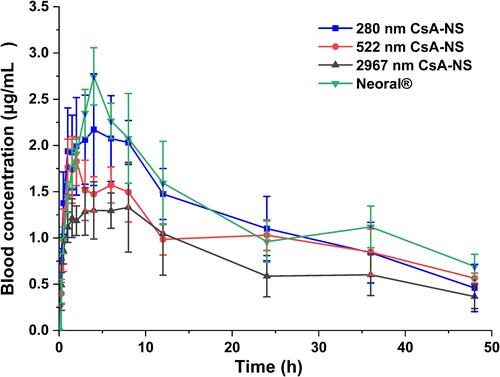
Figure 8 Mean drug blood concentration-time profiles after oral of Neoral® and CsA-NSs at a dose of 25 mg/kg in S.D. rats (n = 6, means ± SD).