Figures & data
Figure 1 Preparation and characterization of the DMP/phBimS complex. (A) Preparation process of the DMP/phBimS complex. (B) Size of the DMP cationic micelle. (C) Zeta potential distribution of the DMP cationic micelle. (D) Gel retarding assay of the DMP/phBimS complex. (E) Transmission electron microscopy (TEM) photomicrographs of DMP (scale bar: 200 nm). (F) Cell viability assay of the action of DMP and PEI25K on 293T cells.
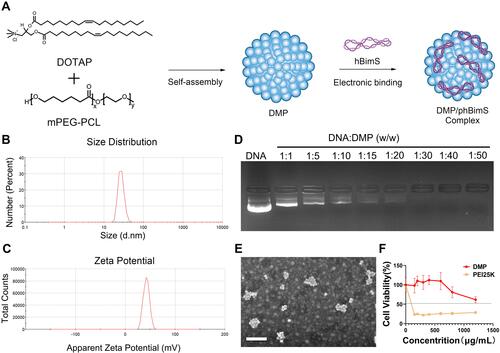
Figure 2 In vitro plasmid transfection study of the DMP/phBimS complex. (A) Fluorescent images of transfected SCC15 and 293T cells (scale bars: 200 μm). (B) Transfection efficiency on SCC15 cells analyzed by flow cytometry. (C) Transfection efficiency on 293T cells analyzed by flow cytometry.
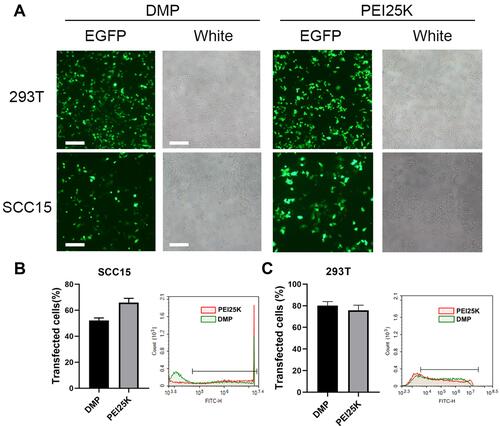
Figure 3 Uptake mechanism study of the DMP/plasmid complex in SCC15 cells. (A) Fluorescent images of internalization of the DMP-039/plasmid complex after pre-treatment by different pathway inhibitors. EGFP plasmid in green (EGFP), cell nuclei in blue (Hoechst), and plasma membranes in red (Dil) (scale bar: 100 μm). (B) Cell uptake efficiencies analyzed by flow cytometry (****P < 0.0001).
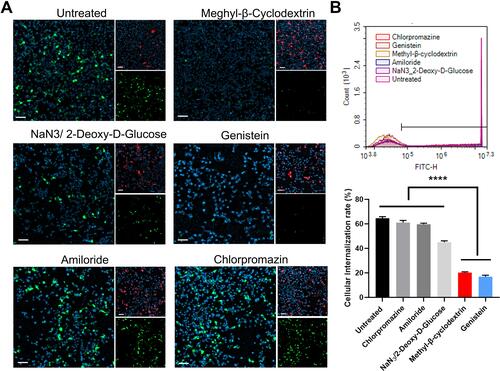
Figure 4 In vitro anti-cancer effect of the DMP/phBimS complex. (A) Intracellular level of BimS mRNA in SCC15 cells after transfection (**P < 0.01). (B) Level of BimS protein in each treatment group. (C) Cell viabilities that measured through the MTT assay (*P < 0.05, ***P < 0.001). (D) Image of SCC15 cells after treatment with the DMP/phBimS complex via MTT assay (scale bar: 200 μm). (E) Calculate of clone numbers detected by clonogenic assay (***P < 0.001, ****P < 0.0001). (F) Detection of the anti-proliferation effect of the DMP/phBimS complex by clonogenic assay; the inhibition rates were calculated based on the clone numbers of each group (***P < 0.001, ****P < 0.0001). (G) The DMP/phBimS complex induced apoptosis efficiently in SCC15 cells after transfection, as measured by flow cytometry (***P < 0.001).
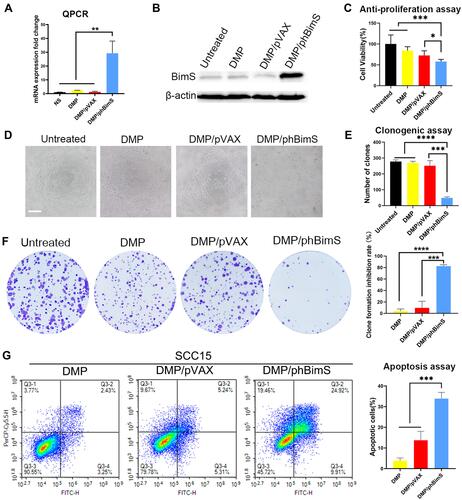
Figure 5 DMP/phBimS complex inhibited tongue squamous cell tumor growth in vivo through local administration. (A) Schematic view of the experimental design. (B) Trend of the change of the mice tongue volume in each group (**P < 0.01, ***P < 0.001). (C) Tumor growth inhibition rate in each group (**P < 0.01). (D) Representative isolated tongue from each group (scale bar: 2.5 mm). (E) H&E analysis of the tongue tissue of each group (scale bar: 750 μm for entire image; scale bar: 150 μm for partial image.). (F) Immunohistochemical evaluation of tumor tissues from each group (scale bar: 100 μm).
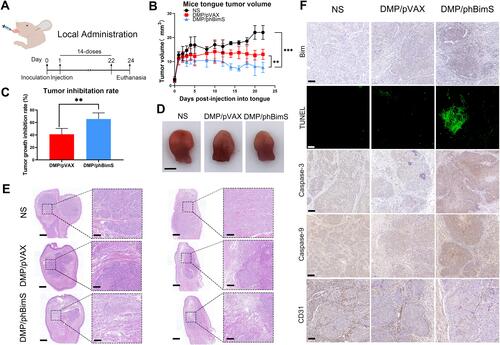
Figure 6 In vivo distribution and metabolism of DMP micelles detected by fluorescence. (A) DMP micelles in the mouse tongue tissue at different timepoints after i.v injection. The fluorescence intensities in tissues were detected and calculated. (B) Major organ distribution in mice 4 h after tail vein injection of DMP micelles with fluorescence intensities.
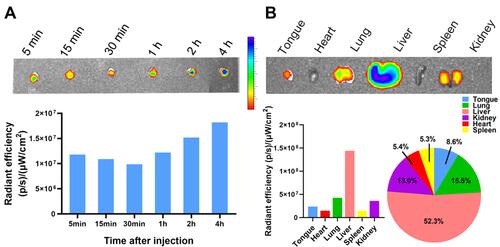
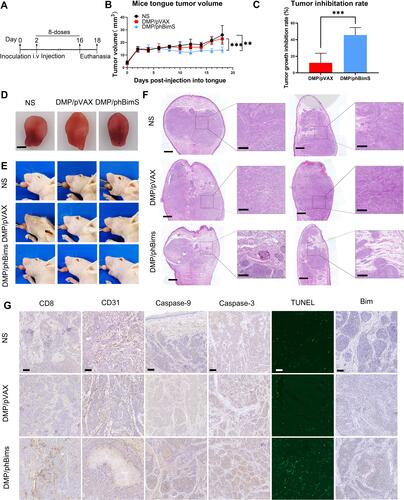
Figure 7 Therapeutic effect of the DMP/phBimS complex in tongue squamous cell tumor in vivo through systemic administration. (A) Schematic view of the whole experiment design and administration arrangement. (B) Trend of change of the mice tongue volume in each group during observation (**P < 0.01, ***P < 0.001). (C) Tumor growth inhibition rate in each group calculated based on tongue volume after euthanasia (***P < 0.001). (D) Representative isolated tongue images from each group after euthanasia (scale bar: 2.5 mm). (E) Representative mouse images of each group after euthanasia. (F) H&E analysis of tongue tissue of each group (scale bar: 750 μm for entire images; scale bar: 150 μm for partial images). (G) Immunohistochemical evaluation of tumor tissues from each group (scale bar: 100 μm).
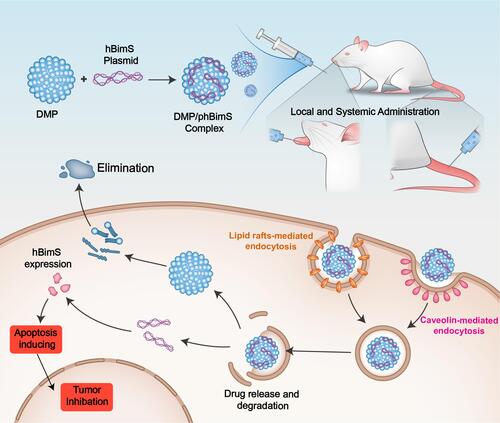
Scheme 1 An overview of the process of DMP/phBimS formulation and entry into cells to evoke tumor inhibition effects.