Figures & data
Table 1 Chemical Structures of Three Detected Types of MDP-Ca Salt
Figure 1 XRD pattern and NMR spectra of synthesized MDP-Ca salts. (A) XRD pattern of synthesized MDP-Ca salts. (B) Typical 31P NMR spectrum of synthesized MDP-Ca salts. (C) Partially enlarged view of the NMR spectrum. The arrows mark the NMR peaks assigned to the phosphorus atoms of the MDP-Ca salts; the corresponding assignments of the numbered peaks are shown in . (D) Curve-fitting results corresponding to the observed 31P NMR spectrum of synthesized MDP-Ca salts. The sky-blue lines correspond to the simulated peaks 3, 5, and 6 for the three MDP-Ca salts. The red line is the resulting overall spectrum.
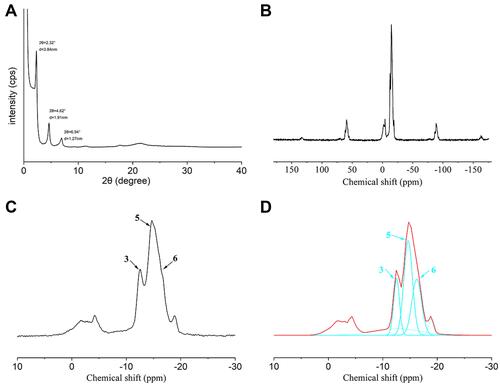
Figure 2 TEM results. (A) TEM image of untreated MDP-Ca salt. (B) Formation of nanolayered structure on untreated MDP-Ca salt, as observed by TEM. (C) TEM image of crystallites within untreated MDP-Ca salt and corresponding diffraction pattern obtained by FFT. (D) TEM image of MDP-Ca salt by attack with acidic solution for 15 min. (E) Discontinuous nanolayered structure of MDP-Ca salt by attack with acidic solution for 15 min. (F) Nanolayered structure of MDP-Ca salt by attack with neutral solution for 15 min.
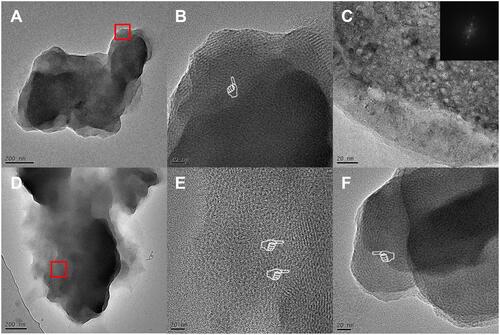
Figure 3 Calcium release from MDP-Ca salts in acid and neutral environments, as measured by ICP-MS.
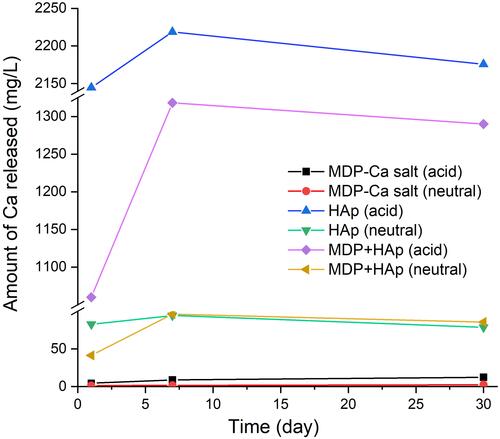
Figure 4 Evolution of MCS-MD hydrolysis in acidic and neutral environments. (A) MD models of MCS-MD molecules in the acidic environment. Yellow and green spheres represent Ca2+ and Cl− ions, respectively. The nanolayered structure loose with free Ca2+ ions and MDP molecules form clusters. (B) MD models of MCS-MD molecules in the neutral environment. Connected blue spheres represent OH− ions. Ca2+ ions always interact with the phosphate group, OH− ions, and water molecules to form cluster structures with a Ca2+ core.
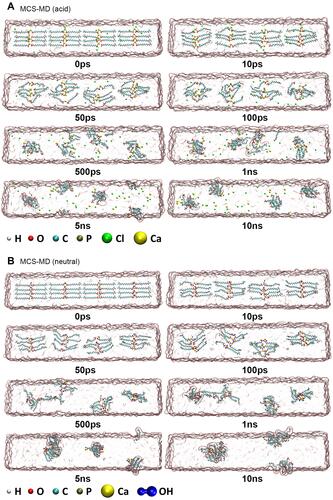
Figure 5 Evolution of DCS-MD hydrolysis in acidic and neutral environments. (A) MD models of DCS-MD molecules in the acidic environment. Yellow and green spheres represent Ca2+ and Cl− ions, respectively. The nanolayered structure collapses in the acidic environment, along with the release of Ca2+ ions and the aggregation of MDP molecules. As the hydrolysis proceeds, MDP molecules form aggregates of different sizes. (B) MD models of DCS-MD molecules in the neutral environment. Connected blue spheres represent OH− ions. In the neutral environment, the structure evolves into a system with two OH− around each Ca2+ ion, forming the first coordination layer with water molecules and the oxygen atoms of the phosphoric acid group. The final formed cluster is a large aggregate of Ca2+, OH−, and MDP molecules.
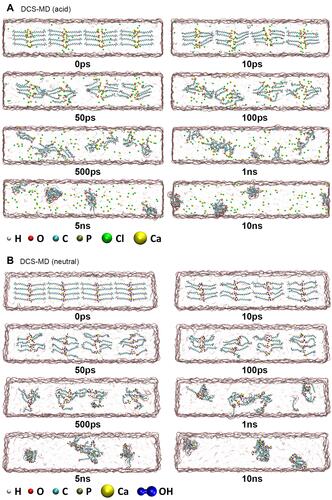
Figure 6 Evolution of MCS-MM hydrolysis in acidic and neutral environments. (A) MD models of amorphous MCS-MM molecules in the acidic environment. MCS-MM was randomly distributed in rectangular water boxes. Yellow and green spheres represent Ca2+ and Cl− ions, respectively. In the acidic environment, Ca2+ ions dissolve in the aqueous solution and MDP molecules aggregate to form clusters. (B) MD models of MCS-MM molecules in the neutral environment. Connected blue spheres represent OH− ions. In the neutral environment, Ca(OH)2 is formed after hydrolysis and continues to interact with water molecules and oxygen atoms of the phosphoric acid group, eventually forming clusters of various sizes.
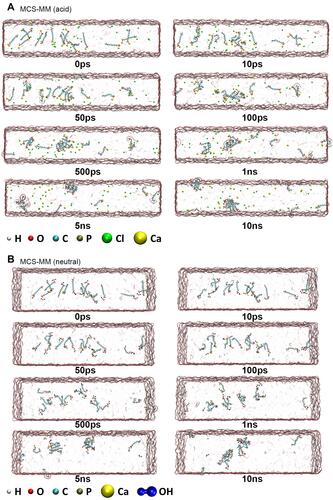
Figure 7 Coordination number of Ca2+ ions during simulations of (A) MCS-MD, (B) DCS-MD, and (C) MCS-MM in acidic and neutral environments (Ca–O bond length < 3.0 Å).
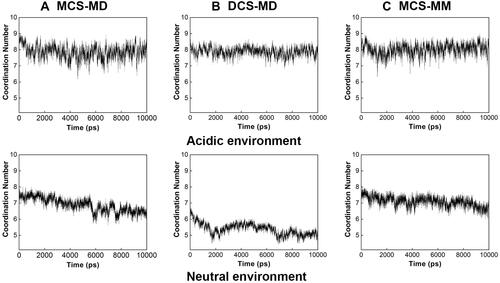
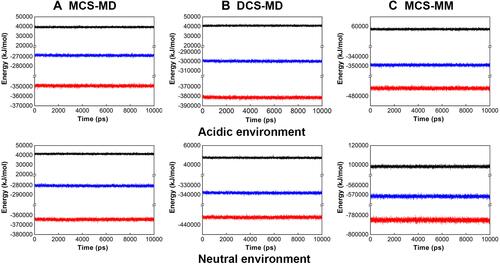
Figure 8 Time evolution of total (blue), Coulomb (red), and van der Waals (black) energies of (A) MCS-MD, (B) DCS-MD, and (C) MCS-MM in acidic and neutral environments.