Figures & data
Figure 1 (A) TEM images of PLT membrane stained with uranyl acetate. Scale bar = 100 nm. (B) Relationship between initial GOx concentration and the concentration of GOx on the PLT-GOx. (C) CLSM images of PLT-GOx, DiD-labeled PLT (green), and rhodamine B (red)-modified biotin-GOx were used to fabricate PLT-GOx.
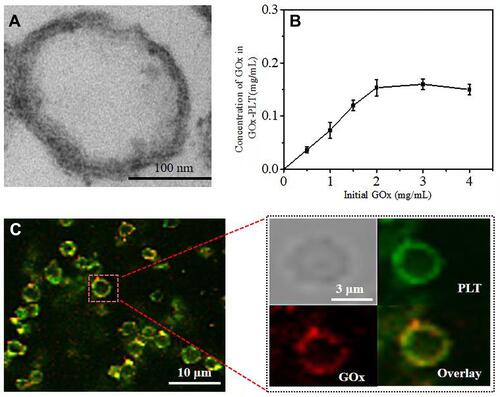
Figure 2 (A) TEM images of HMCuS, (B) HMCuS-DOX and (C) HMMD nanoparticles. (D–G) EDS elemental mapping of HMMD. ((D) Cu element (green color), (E) S element (purple color), (F) Mn element (yellow color), (G) O element (blue color)). (H) XPS of Cu2p, (I) S2p, and (J) Mn2p raised from HMMD nanoparticles. (K) UV–vis absorption spectra of HMCuS, HMCuS-DOX, HMMD and HMMD @PG.
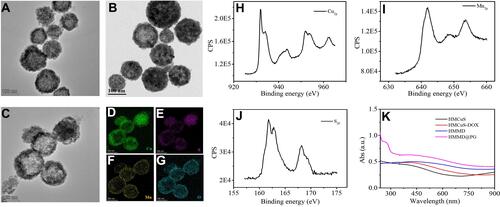
Figure 3 (A) Time-dependent glucose consumption in the PBS (0.01 M, pH = 7.4) solution containing 1 mg/mL of glucose and 16 µg/mL of GOx. (B) Time-dependent H2O2 generation in the PBS (0.01 M, pH = 7.4) containing 1 mg/mL of glucose and 16 µg/mL of GOx concentration. (C) Dissolved O2 generation kinetics of HMMD and HMMD@PG in the PBS (0.01 M, pH = 7.4) solution. (D) UV–vis spectra of DTNB, DTNB + GSH, and DTNB + GSH + HMCuS-MnO2 after 30 min of incubation. (E) UV–vis spectra of DTNB, DTNB + GSH, and DTNB + GSH containing different concentrations of HMCuS-MnO2 after 30 min of incubation. (F) UV–vis spectra of MB in the PBS (0.01 M, pH = 7.4) solution after the addition of HMCuS-MnO2, GSH and H2O2. (G) UV–vis spectra of MB in the PBS (0.01 M, pH = 7.4) solution in the presence of HMCuS-MnO2, GSH and H2O2 after NIR laser irradiation (1.5 W/cm2, 808 nm) for different time. (H) Photothermal conversion curves of a suspension of the HMMD@PG with various concentrations under NIR laser irradiation (1.5 W/cm2, 808 nm) for 8 min. (I) DOX release profiles of HMMD@PG under different conditions.
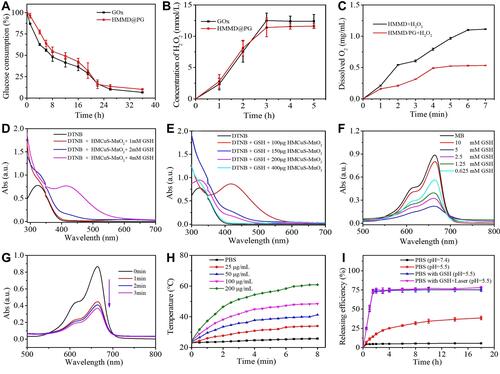
Figure 4 (A) CLSM images of 4T1 cells incubated with HMMD and HMMD@PG for 1 h and 3 h. The cell nuclei were stained as blue by DAPI, red was the fluorescence of DOX. Scale bar: 30 µm. (B) CLSM images of 4T1 cells incubated with different materials using hypoxia detection probes. Scale bar: 50 µm. (C) CLSM images of 4T1 cells incubated with HMMD (100 µg/mL), HMMD@PG (100 µg/mL) and HMMD@PG (100 µg/mL) + L to evaluate the ROS generating capabilities of HMMD@PG in vitro. Scale bar: 30 µm. (D) MFI of 4T1 cells co-incubated with different materials on 1h and 3h. (E) The analysis of hypoxia levels by MFI in 4T1 cells co-incubated with different materials. (F) The analysis of ROS levels by MFI in 4T1 cells co-incubated with different materials. Data were shown as means ± SD (n = 3). ** p < 0.01, *** p < 0.001, **** p < 0.0001.
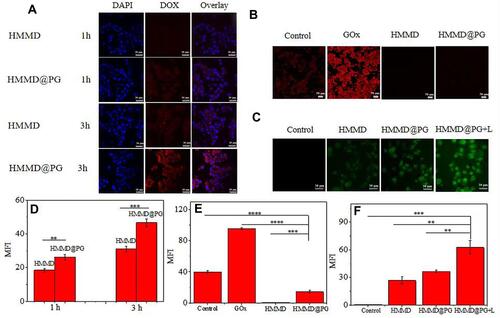
Figure 5 In vitro cytotoxicity study. (A) Cell viability of 4T1 cells treated with HMCuS@PLT. (B) Cell viability of 4T1 cells treated with PBS, DOX, HMMD, HMMD@PG and HMMD@PG + L (1.5 W/cm2 6min) respectively. (C) Fluorescence images of 4T1 cells treated with PBS, DOX, HMMD, HMMD@PG and HMMD@PG + L (1.5 W/cm2 6min). Scale bar: 50 µm. Data were shown as means ± SD (n = 3). * p < 0.05, ** p < 0.01, *** p < 0.001.
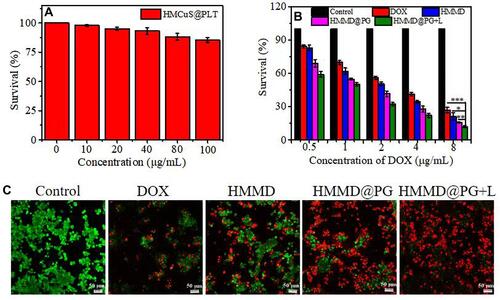
Figure 6 (A) Fluorescence distribution at 0 h, 2 h, 4 h, 12 h, 24 h and 48h after injection of ICG and HMCuS-ICG-MnO2@PG (ICG = 100 µg/mL, 200 µL) in 4T1 tumor-bearing nude mice. (B) Region-of-interest analysis of fluorescent intensities from the tumors (green fluorescence represents live cells, red fluorescence represents dead cells). Data were shown as means ± SD (n = 3).
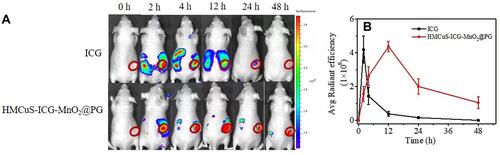
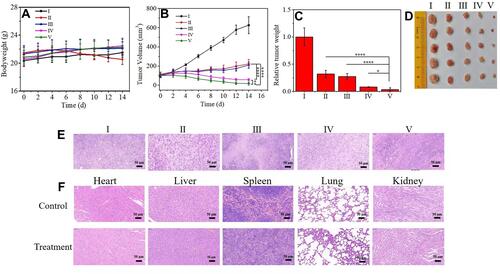
Figure 7 In vivo anticancer study of HMMD@PG +L on 4T1-tumor-bearing mice based on intravenous administration. (I) PBS (control group), (II) DOX, (III) HMMD, (IV) HMMD@PG, (V) HMMD@PG + L. (A) Body weight, (B) tumor volume, (C) relative tumor weight and (D) tumor tissue images of 4T1-tumor-bearing mice with different treatments over 14 days. (E) H&E staining images of the dissected tumor tissues and (F) organs after 14 days of treatment. Scale bar: 50 µm. n = 5, *p < 0.05, **p < 0.01, ****p < 0.0001.