Figures & data
Table 1 Primers for qPCR
Table 2 Classification of Disc Degeneration
Table 3 Histological Grading Scale
Figure 1 Synthesis and characterization of MnO2 NPs. (A) Digital picture and TEM images of MnO2 NPs. (B) EDS analysis of MnO2 NPs. (C) Relative viabilities of NPCs treated with various concentrations of MnO2 NPs for 24 h. *, p<0.05.
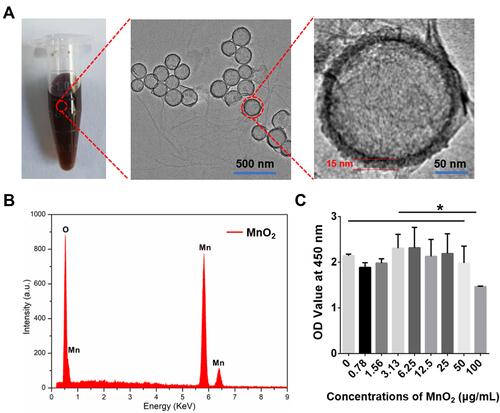
Figure 2 Nanoparticle decomposition and drug behaviors of TGF-β3/MnO2. In vitro release of TGF-β3 from MnO2 NPs at different pH values (7.4 and 6.5) in the absence or presence of 100 μM H2O2.
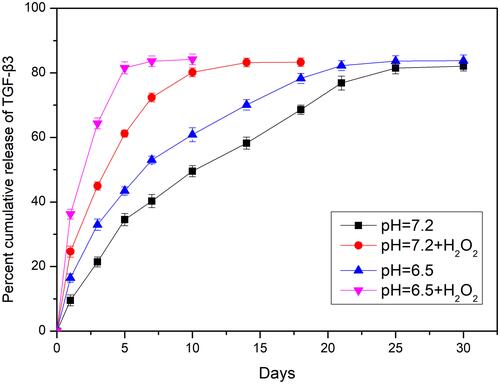
Figure 3 Representative images of NPC uptake of BSA/MnO2 and FITC-BSA/MnO2 for 12 h. Green, red and blue colors represent FITC-BSA/MnO2, F-actin, and DAPI fluorescence, respectively.
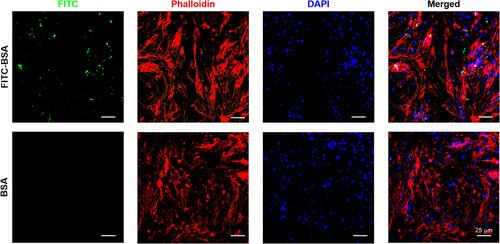
Figure 4 Antioxidant activity of TGF-β3/MnO2 NPs. (A) Representative fluorescent images of NPCs stained with DCFH-DA in the Ctrl, H2O2, MnO2, TGF-β3, and TGF-β3/MnO2 groups, respectively. (B–D) qPCR analyses of the relative expression of the SOD1, SOD2, and CAT genes of the NPCs in Ctrl, H2O2, MnO2, TGF-β3, and TGF-β3/MnO2 groups, respectively. *, p<0.05.
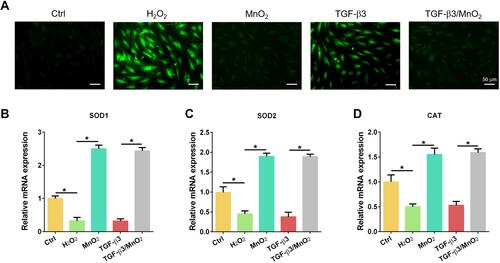
Figure 5 Anti-apoptotic and proliferative effects of TGF-β3/MnO2. qPCR analyses of the relative expression of apoptotic (BAX) (A) and anti-apoptotic (MCL1 and BCL2) (B and C) genes of NPCs in the Ctrl, H2O2, MnO2, TGF-β3, and TGF-β3/MnO2 groups, respectively. (D) Representative images of EdU staining of NPCs in the Ctrl, H2O2, MnO2, TGF-β3, and TGF-β3/MnO2 groups, respectively. Green represents EdU-labeled proliferating cells and blue represents nuclei. (E) Quantification of the percentage of EdU-positive cells in the Ctrl, H2O2, MnO2, TGF-β3, and TGF-β3/MnO2 groups, respectively. *, p<0.05.
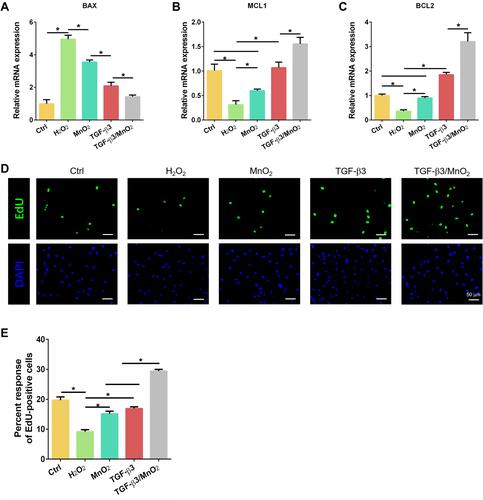
Figure 6 TGF-β3/MnO2 regulating the ECM metabolic balance of NPCs in vitro. qPCR analyses of the relative expression of anabolic (Col-II and ACAN) (A and B), pro-inflammatory (COX-2 and iNOS) (C and D), and catabolic (MMP3 and Adamts5) (E and F) genes in the NPCs of the Ctrl, H2O2, MnO2, TGF-β3, and TGF-β3/MnO2 groups, respectively. *, p<0.05.
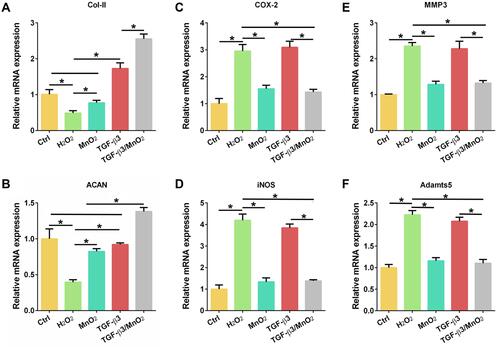
Figure 7 Immunofluorescent analysis of Col-II and iNOS expression in NPCs. Representative images of the immunofluorescence of Col-II (A) with semi-quantitative analysis (B) and iNOS (C) with semi-quantitative analysis (D) in the NPCs of the Ctrl, H2O2, MnO2, TGF-β3, and TGF-β3/MnO2 groups, respectively. Red, green and blue colors indicate Col-II protein, iNOS protein and DAPI fluorescence, respectively. *, p<0.05.
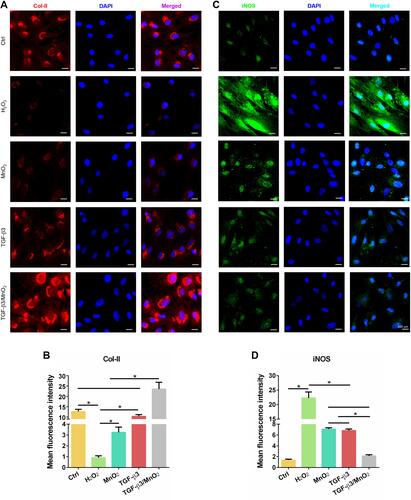
Figure 8 Evaluation of disc degeneration with T2-weighted MRI and gross appearance. Representative images of disc gross appearance (A) and MRI signal intensity (B) at 4 and 8 weeks. Changes in MRI grade at 4 and 8 weeks after surgery (C and D). *, p<0.05.
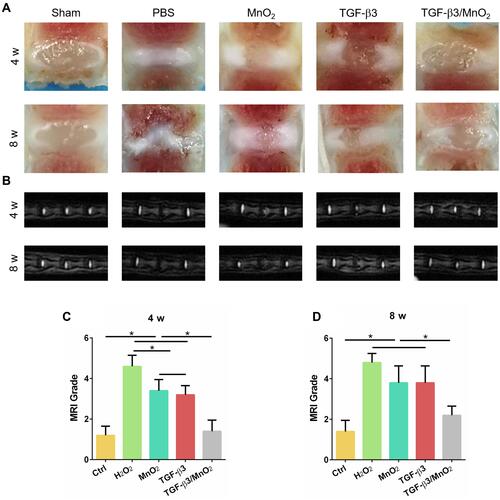
Figure 9 Histopathological evaluation in vivo. H&E (A) and Safranin O-Fast Green (B) images of IVDs in the rat caudal vertebrae at 4 and 8 weeks. The histopathological scores of different groups at 4 and 8 weeks after surgery (C and D). *, p<0.05.
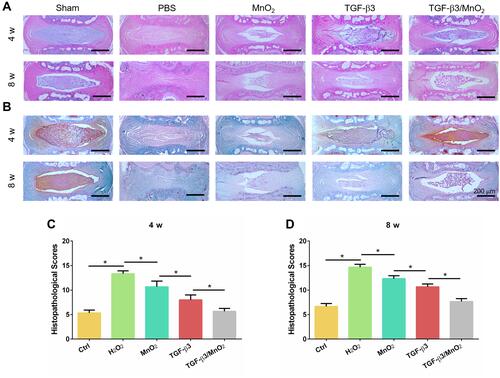
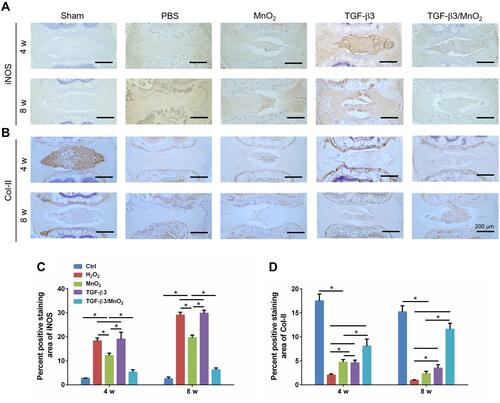
Figure 10 Immunohistochemical analysis of iNOS and Col-II expression in each group. Representative images of the immunohistochemical staining of iNOS (A) and Col-II (B) at 4 and 8 weeks after surgery, and the semi-quantitative analysis of iNOS (C) and COL-II (D) at these timepoints. *, p<0.05.