Figures & data
Figure 1 The ee-As4S4 induced multi-lineage differentiation of Kasumi-1 cells. (A–C) Overlap distribution of CD11b, CD235a, and CD41a. The filled gray peak indicated the control group, and the concentration of ee-As4S4 In (A–C and G) is 4.0 mg/L. (D–F) The portion of differentiation marker positive cells. (G) Plot distribution of Kasumi-1 cells defined by CD11b and CD235a antibodies. The incubation time for all experiments is 72 h. *P<0.05, ***P<0.001.
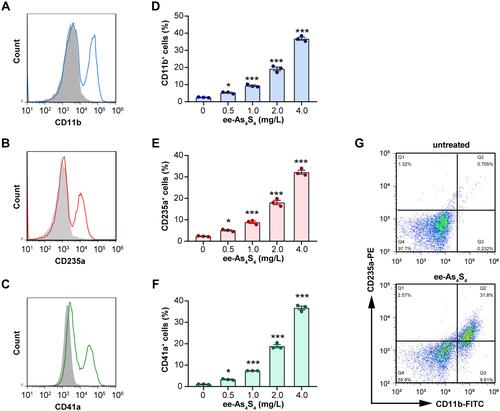
Figure 2 The ee-As4S4 induced post-differentiation apoptosis of Kasumi-1 cells. (A–C) Representative plots distribution of the Kasumi-1 cells incubated with ee-As4S4 at 2.0 mg/L for 72 h after co-staining with Annexin V and antibodies against differentiation markers. (D–F) Proportion of Annexin V and differentiation marker double-positive cells. (G) Western blot of pro-caspase 3 and caspase 3 after incubation with ee-As4S4 for 72 h. (H) Caspase-3 activity after incubation with ee-As4S4 for 72 h. *P<0.05, ***P<0.001.
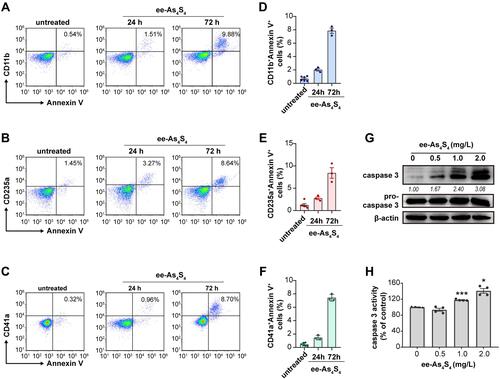
Figure 3 Ee-As4S4 inhibited the activity of HDAC in Kasumi-1 cells. (A) HDAC activity in lysate Kasumi-1 cell that incubated with ee-As4S4 for 72 h. (B) The expression of acetylated histone H3 determined by Western Blotting in Kasumi-1 cell that incubated with ee-As4S4 for 72 h. (C–E) Relative mRNA levels of CEBPA, PU.1, and GATA1 of Kasumi-1 cells incubated with ee-As4S4 at 2.0 mg/L for 48 h. *P<0.05 ***P<0.001.
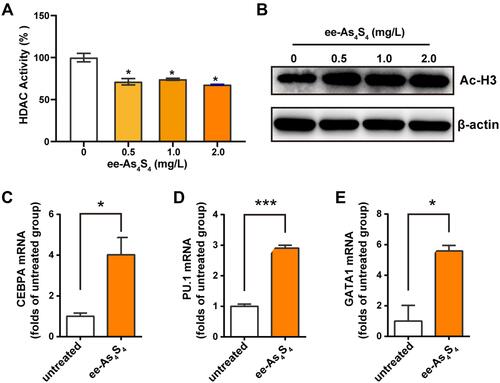
Figure 4 The ee-As4S4 induced multi-lineage differentiation in vivo. (A) Illustration of the bone marrow assay and the gated scheme, cells in Gate 1 are leukemia cells. (B–D) Overlap distribution of CD11b, Ter119, and CD41 expression in the leukemia cells in the control group and the ee-As4S4-treated group. (E–G) Mean fluorescence intensity of the three markers in leukemia cells. (n=4) (H–J) Immunofluorescence staining of the three markers in femurs of mice from control and ee-As4S4 group.
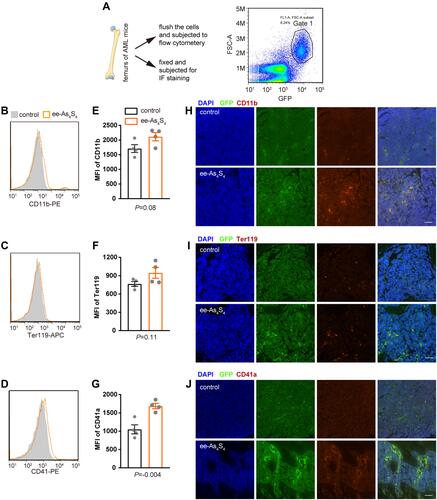
Figure 5 The ee-As4S4 induced apoptosis in vivo. (A) The percentage of GFP+ leukemia cells in the bone marrow determined by flow cytometry. (B) Immunofluorescence staining of cleaved caspase-3 in the femur of mice from control and ee-As4S4 group. (C and D) The weight of spleen and liver of AML mice (n=5). (E–G). The count of WBC, RBC, and PLT (n=5). (H) Survival curve of AML mice (n=7). *P < 0.05, **P<0.01.
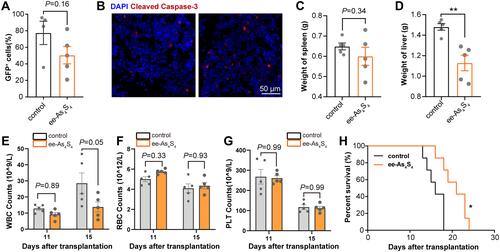
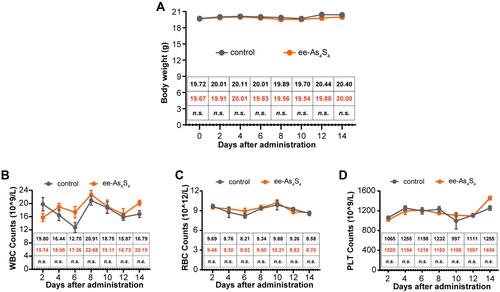
Figure 6 The in vivo safety of ee-As4S4 in healthy mice. (A) The bodyweight of mice for each group (n=6). (B–D) The counts of WBC (B), RBC (C), and PLT (D) were analyzed after the administration for 14 days (n=6). Mean of body weight, WBC, RBC, and PLT count were listed in the inserted table, the mean of the control group was black-colored, and that of the ee-As4S4 treated group is Orange-colored. “n.s.” indicates no significance between the two groups in the same day.