Figures & data
Figure 1 The schematic diagram for the process of D-gal-FFYEE-hyd-DOX synthesis, assembly, endocytosis and intracellular drug release.
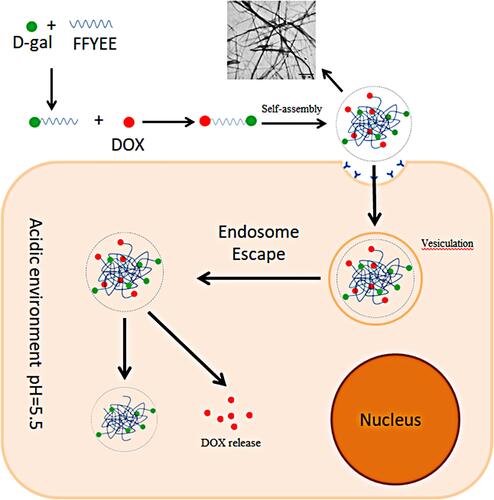
Figure 2 Graphical synthesis route of D-gal-FFYEE-hyd-DOX. FFYEE (1), D-gal-FFYEE (2), D-gal-FFYEE of removing the tert-butyl protective group (3), D-gal-FFYEE connected with hydrazide group (4), and D-gal-FFYEE-hyd-DOX (5).
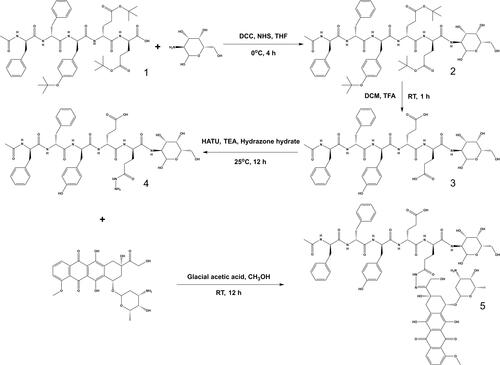
Figure 3 Mass spectrograms of peptide FFYEE (A), compound 2 (B), compound 3 (C), compound 4 (D) and the final product 5 (E).
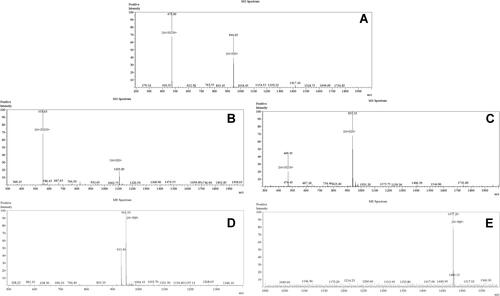
Figure 4 The infrared spectrum of the D-gal-FFYEE connected D-gal (A), and the final product D-gal-FFYEE-hyd-DOX (B).
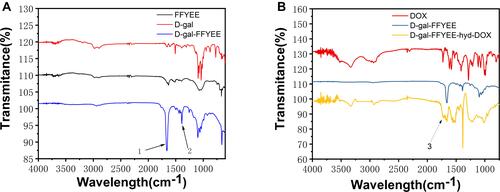
Figure 5 UV-Vis spectrum of D-gal-FFYEE-hyd-DOX and DOX.
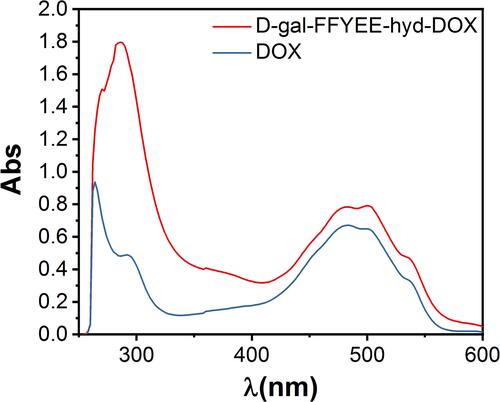
Figure 6 Transmission electron microscopy (TEM) micrographs of the FFYEE fibers (A) and D-gal-FFYEE-hyd-DOX fibers (B).
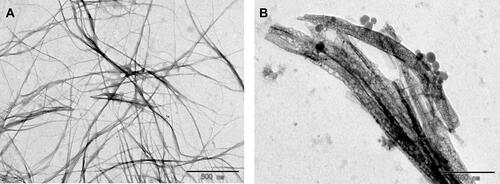
Figure 7 In vitro DOX release of D-gal-FFYEE-hyd-DOX in PBS (pH 7.4) or PBS (pH 5.5).
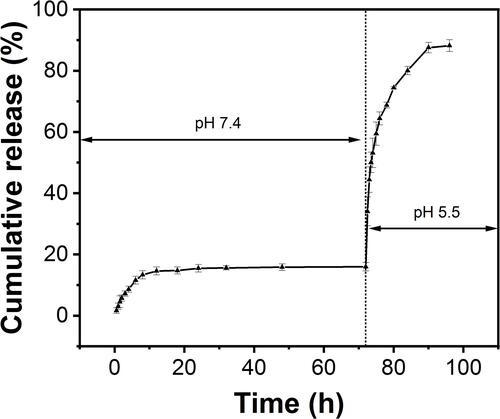
Figure 8 Cell viability of HepG2 cells incubated with D-gal-FFYEE-hyd-DOX and free DOX for 6 h and 12 h (A). Cell viability of EC109, L02 and HepG2 cells incubated with D-gal-FFYEE-hyd-DOX for 12 h (B). Data are presented as the average (SD, n = 3).
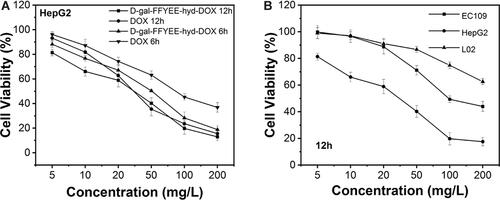
Figure 9 Fluorescence inverted microscope image of L02, EC109 and HepG2 cells that were incubated with free DOX and D-gal-FFYEE-hyd-DOX for 6 h, respectively. Blue and red dots stand for the fluorescence of DAPI and DOX, respectively. The scale bar is 50 µm.
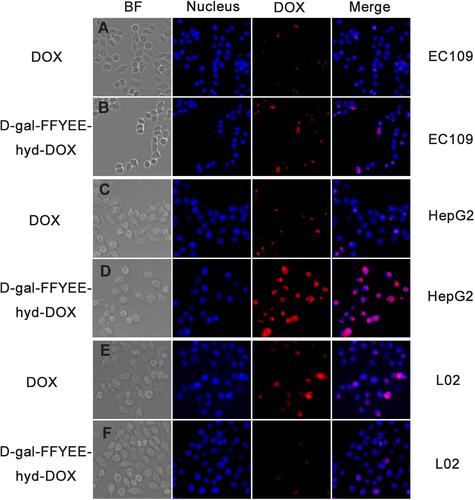
Figure 10 In vivo anti-tumor effect of D-gal-FFYEE-hyd-DOX. (A) Tumor growth curves, (B) body weight change curves, (C) representative tumor tissue image in male mice bearing H22 tumor after intravenous administration. The data are presented as the mean ± SD (n = 5). **P < 0.05 DOX vs D-gal-FFYEE-hyd-DOX.
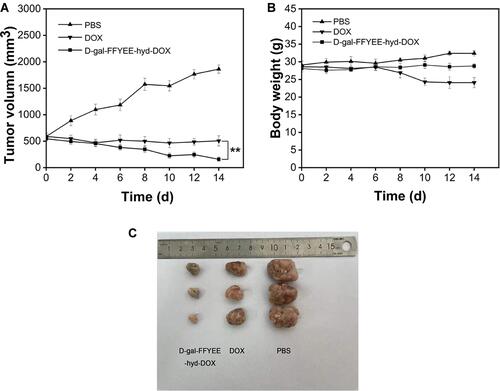
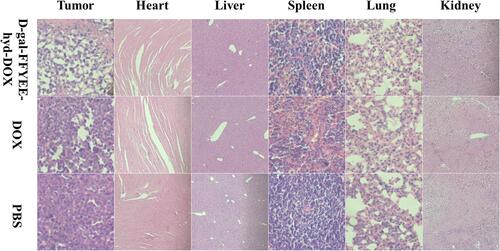
Figure 11 H&E staining of tumor tissue and other tissues isolated from male mice bearing H22 tumor after administration of D-gal-FFYEE-hyd-DOX, DOX and PBS.