Figures & data
Figure 1 The characteristic f Se/CDs. (A) The TEM characteristic of Se/CDs. (B) The 200 nm, 10 nm morphology and lattice of Se/CDs. (C) XPS spectrum of Se-CDs. (D) The FT-IR spectrum scanning from 4000 cm-1 to 800 cm-1. (E) The UV absorption (blue), excitation (black), and emission (red) spectra of Se-CDs (λex =340 nm, λem = 360 nm). (F) The normalized excitation-dependent fluorescence emissions of Se/CDs (340–480 nm).
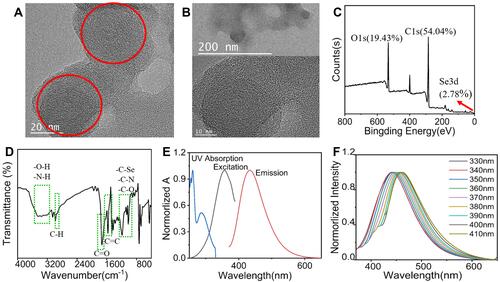
Figure 2 The effect of Se/CDs’ supplementation on the IVM efficiency of ovine oocytes. (A) Morphology of COCs before IVM, COCs after IVM and MII oocytes. (B) Maturation rates.
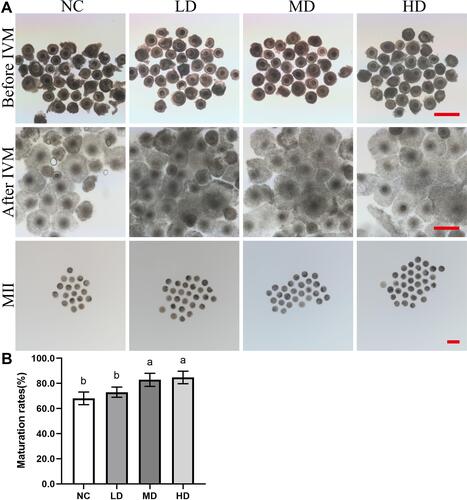
Figure 3 The effect of Se/CDs’ supplementation on the cytoplasmic maturation, mitochondrial activities and ROS production levels of ovine MII oocytes.
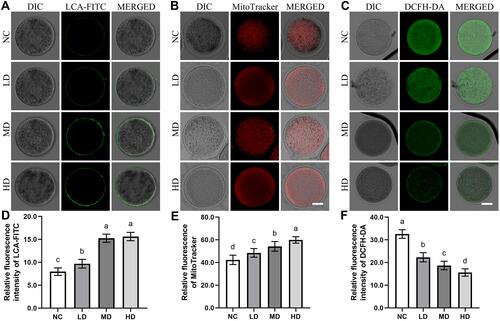
Figure 4 The effect of Se/CDs’ supplementation on the histone methylation levels of ovine MII oocytes. (A) H3K9me3 immunofluorescence staining of ovine MII oocytes. (B) H3K27me3 immunofluorescence staining of ovine MII oocytes. (C) Relative fluorescence intensity of H3K9me3. (D) Relative fluorescence intensity of H3K27me3.
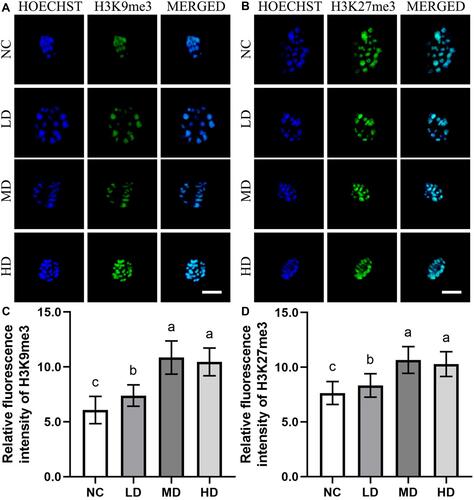
Figure 5 The effect of Se/CDs’ supplementation on the DNA methylation levels of ovine MII oocytes. (A) 5mC immunofluorescence staining of ovine MII oocytes. (B) 5hmC immunofluorescence staining of ovine MII oocytes. (C) Relative fluorescence intensity of 5mC. (D) Relative fluorescence intensity of 5hmC.
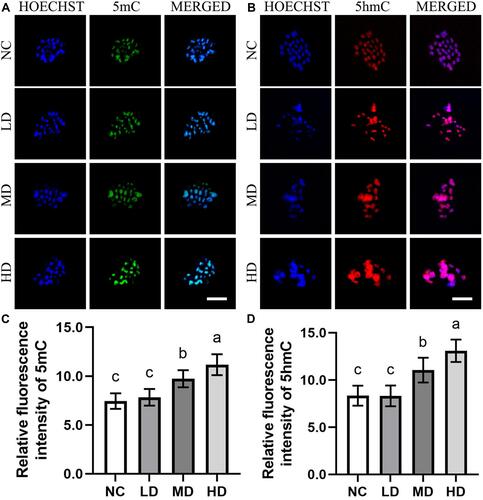
Figure 6 The effect of Se/CDs’ supplementation on the embryonic development potentials of ovine MII oocytes. (A) Morphology of 2-cells after IVF. (B) Fertilization rates. (C) Blastocyst development rates.
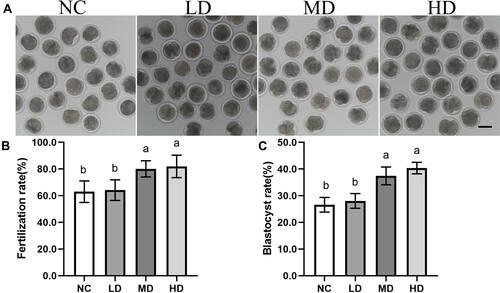
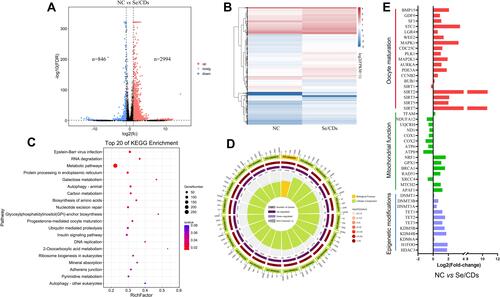
Figure 7 The effect of Se/CDs’ supplementation on the transcript profiles of ovine MII oocytes. (A) Numbers of differentially expressed genes (DEGs) that are abnormally repressed (blue) or upregulated (red) in the Se/CDs group compared to the NC group. (B) Heatmap illustration showing the DEGs in the Se/CDs group compared to the NC group. (C) Top 20 KEGG pathways enriched in the Se/CDs group compared to the NC group. (D) GO analyses of the DEGs in the Se/CDs group compared to the NC group. (E) Expression levels of DEGs related to oocyte maturation, mitochondrial functions and epigenetic modifications in the NC and Se/CDs groups.