Figures & data
Scheme 1 Schematic demonstration of FUS/chemo synergistic therapy strategy.
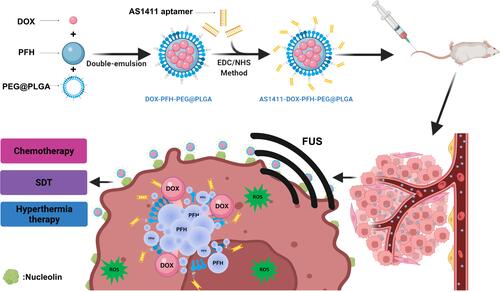
Table 1 The Physical Characterizations of Nanoparticles
Figure 1 Physical and chemical characterization of the AS1411-DOX/PFH-PEG@PLGA NPs (A-DPPs). (A) TEM image of the A-DPPs (left scale bar=2 μm, middle scale bar=0.2 μm, right scale bar=0.5 μm). (B) The average size of A-DPPs. (C) The zeta Potential of A-DPPs. (D) The size distribution of A-DPPs in FBS within 7 days. The A-DPPs displayed a uniform size and negative zeta-potential with good bio-stability in vitro. (E) Cumulative DOX release at different pHs and FUS-exposure conditions was examined by UV-vis spectrophotometer. (F) The plasma pharmacokinetics of DOX from nanoparticles. The data were represented by mean±SD (n = 3). DOX released from A-DPPs was prolonged in vivo. **P < 0.01.
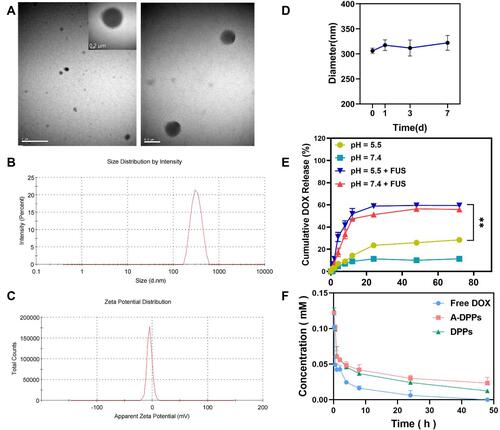
Figure 2 In vitro and vivo biosafety evaluation. Cell viability of free DOX, DPPs, A-DPPs on L-O2 human normal cells (A) and murine TNBC 4T1 cells (B) were measured by CCK-8 assay. The results showed that A-DPPs could inhibit 4T1 cells in a dose-dependent manner except for normal cells L-O2. (C) Hemolysis assays (n = 3). (D) Blood biochemistry analysis (n = 3). (E) H&E stained images of major organs of Balb/c mice post i.v. (scale bar = 200 μm). The results revealed that A-DPPs have a great biosafety in mice. **P < 0.01, ***P < 0.001.
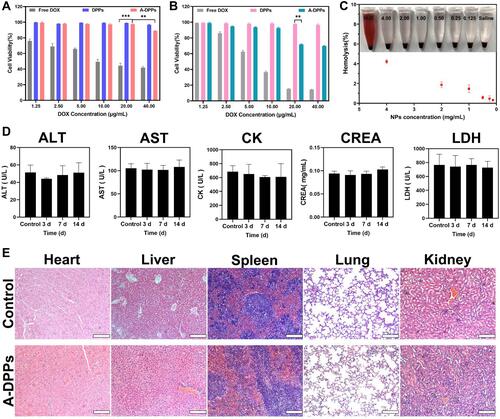
Figure 3 In vitro targeting ability of A-DPPs. (A) The conjugation of AS1411 aptamer with DPPs verified by CLSM and (B) the combination rate by flow cytometry. (C) Fluorescence signals in negative group (A-DPPs in L-O2 cells), non-targeted group (DPPs in 4T1 cells) and targeted group (A-DPPs in 4T1 cells) by CLSM (scale bar = 100 μm). (D) Cellular uptake of negative group, non-targeted group and targeted group by Flow Cytometry.
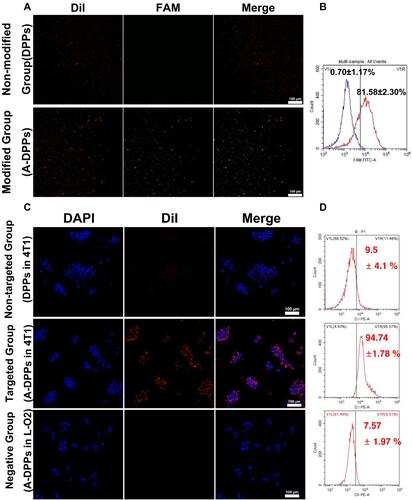
Figure 4 In vivo A-DPPs targeting and distribution. (A) Fluorescence intensity images of tumor-bearing Balb/c mice after being intravenously injected with DPPs and A-DPPs respectively at pre i.v., 3 h, 6 h, 9 h, 24 h and 48 h (n = 3). (B) Average fluorescence intensity of tumor sites for 48 hours. (C) The CLSM of tumor slices at 24 h after i.v. (scale bar = 20 μm). (D) Average fluorescence intensity histogram and (E) fluorescence intensity images of tumors and major organs isolated at 48 h post i.v. (n = 3). The data were represented by mean±SD. **P < 0.01.
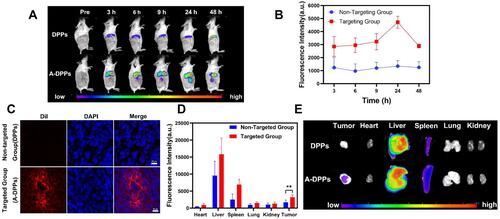
Figure 5 Phase transition of A-DPPs and US imaging in vitro and vivo. (A) Optical images of phase transition of A-DPPs heated at different temperatures (a: before heating, b: 60°C, c: 80°C, d: 90°C), and optical pictures of FUS-induced phase transformation of A-DPPs (e: before FUS, f: after FUS)(×100 magnification). (B) Gray level difference in B-mode and CEUS, and (C) Mean gray value of CEUS mode in ROI before and after FUS exposure in vitro. (D) CEUS mode images of ROI in tumor-bearing mice after intravenous injection of A-DPPs, DPPs and saline (n = 3). (E) Mean gray value of CEUS in tumor sites of different treatments before and after FUS exposure at 80 W/cm2, 5 s. **P < 0.01,***P < 0.001,****P < 0.0001.
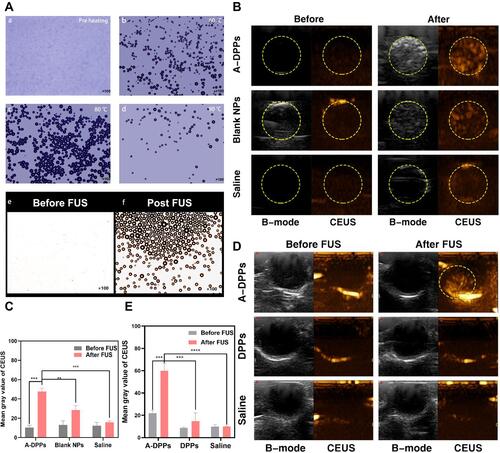
Figure 6 ROS production of A-DPPs with FUS in vitro. (A) Green fluorescence intensity of intracellular ROS production in cells captured by CLSM qualitatively and by flow cytometry (B) and (C) quantitative results. (scale bar = 100 μm). *P < 0.05, **P < 0.01.
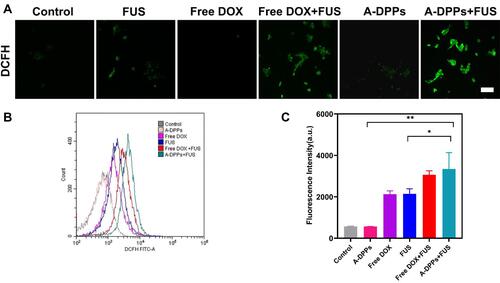
Figure 7 A-DPPs combined with FUS induce 4T1 cell apoptosis and inhibit cells invasion in vitro. (A) Confocal images of fluorescence signals by annexin V-PI staining in 4T1 cells (red: dead cells, green: live cells; scale bar =100 μm). Flow cytometric analysis of apoptosis in 4T1 cells using annexinV-PI staining (B) and quantitative results (C). The invasion of cells was determined by Transwell Chamber assay and results were represented in qualitatively (D) and quantitatively (E). The data were represented by mean±SD. **P < 0.01, ***P < 0.001, ****P < 0.0001.
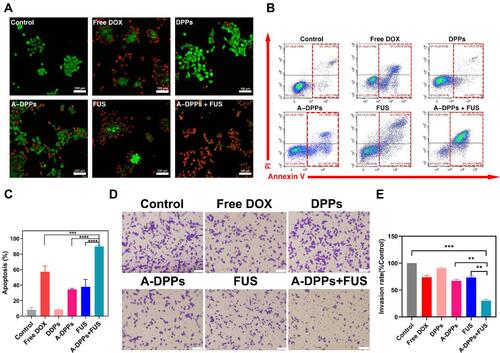
Figure 8 In vivo synergistic effects of A-DPPs mediated FUS/chemotherapy. (A) The illustration of therapy in tumor-bearing mice. (B) Digital photos of tumor-bearing mice and isolated tumors at Day 15 post different treatments. (C) Tumor volumes and (D) mice relative body weight in different treatments for successive 15 days (n = 4) for each group. (E) Survival curve of tumor-bearing mice after different therapies (n = 6). (F) H&E stained images and immunohistochemistry photos of tumors conducted by different treatments. The data were represented by mean±SD for each group. ***P < 0.001, ****P < 0.0001.
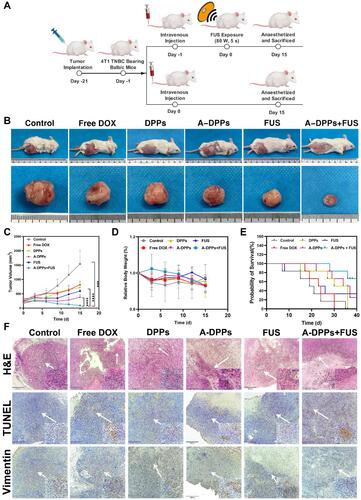
Table 2 Comparison of FUS EEF in Fresh Bovine Livers in vitro
Table 3 Comparison of FUS EEF in Tumors in vivo
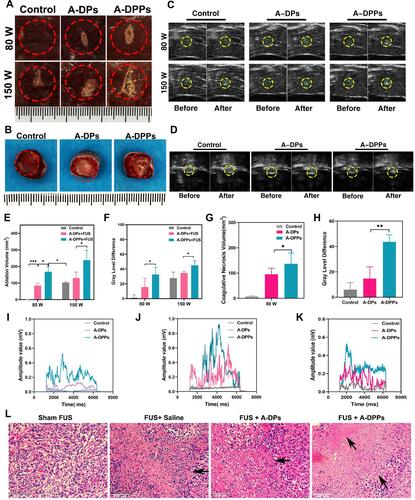
Figure 9 In vitro and vivo enhanced thermal effect and acoustic cavitation effect of FUS assisted by A-DPPs. (A) Digital photos of ablated areas in vitro fresh bovine livers after the injection of A-DPPs, A-DPs, and saline, followed by FUS exposure (80 W/cm2, 5 s and 150W/cm2, 5 s). (B) Photos of coagulative necrosis in tumor-bearing mice in vivo at FUS parameter (80 W/cm2, 5 s). (C) Real-time Ultrasound images in bovine livers before and after FUS exposure (80 W/cm2, 5 s and 150 W/cm2, 5 s) and (D) in tumor sites prior and post FUS (80 W/cm2, 5 s). (E) Volumes of coagulative necrosis and (F) grayscale value difference of ROI in bovine livers. (G) Volumes of coagulative necrosis and (H) grayscale value difference of ROI in tumor-bearing mice. The passive cavitation signals of different treatments in bovine livers at 80 W/cm2 (I) and 150 W/cm2 (J) for 5 s and in vivo mice at 80 W/cm2 for 5 s (K). (L) Histological changes of tumor sites by different treatments after 24 h of FUS exposure were performed by H&E staining. The ablated volume was larger and cavitation signals were stronger in the A-DPPs group than that in other groups after FUS exposure at the same condition. Necrosis was distinct in the A-DPPs group such as cell pyknosis, nuclear pyknosis with heavy staining, widened cell gaps, and intact cellular contours. The data were represented by mean±SD (n = 3) for each group. *P < 0.05, **P < 0.01, ***P < 0.001.