Figures & data
Figure 1 Characterization of the prepared CWSNs. (A) TEM image and (B) histogram of the CWSN size distribution. (C and D) HRTEM images of CWSNs, yellow arrows indicating crystal lattice of the CWSNs. (E) HAADF-STEM images of the CWSNs and elemental mapping images of Cu, W, and S. (F) XRD pattern of the CWSNs. (G) Zeta potentials of the CWSNs. (H) FTIR spectrum of the CWSNs. (I) Fluorescence emission spectra (excited at 312, 320, and 420 nm) of the CWSNs.
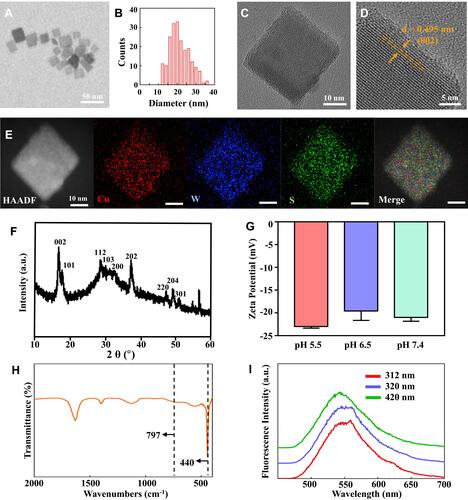
Figure 2 Photocatalytic induction of ROS formation by CWSNs. (A) Schematic showing the CWSN-mediated inactivation of bacteria through visible-light photocatalytic ROS generation. (B) Bandgap of the CWSNs, in which hʋ is the photon energy and α is the absorption coefficient. (C) The VB edge of the CWSNs measured by using UPS. (D) Band position of the CWSNs with respect to ROS formation (OH•) potential. (E) Fluorescence spectra of TA with and without incubation with CWSNs.
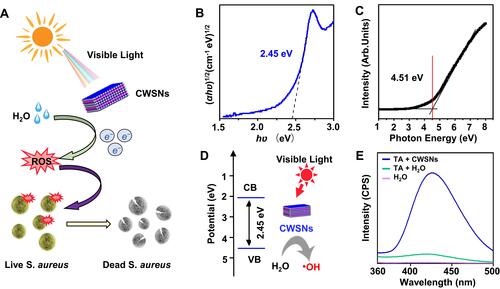
Figure 3 The antibacterial action of CWSNs in vitro. (A and B) Representative TEM images of PBS- and CWSN-treated S. aureus cells. Yellow arrows indicating bacteria-binding CWSNs. (C) Elemental mapping of S. aureus cells exposed to PBS or CWSNs. (D) SEM images of S. aureus treated with saline and 2 μg/mL CWSNs with or without visible-light stimulation. Red arrows indicating damaged and wrinkled S. aureus. (E) Original images and (F) CFU number of S. aureus after different treatments. (G) Photographs of bacterial broth plates and (H) bacterial viability of MRSA after treatment with 2 μg/mL Van or CWSNs. The statistical significance of differences between the indicated groups. ***P < 0.001, ****P < 0.0001.
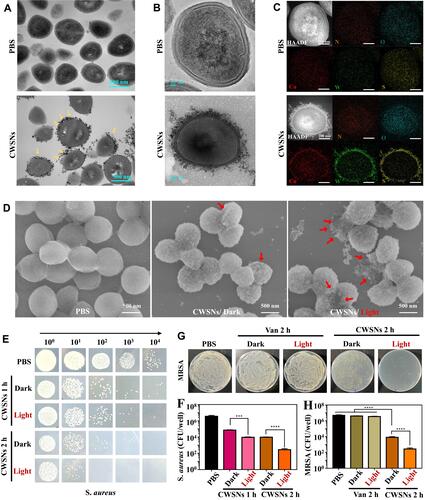
Figure 4 Inhibition of S. aureus biofilm formation. (A) Photograph of S. aureus biofilms after treatment with different concentrations of CWSNs followed by crystal violet staining. (B) Inactivation efficiency of S. aureus biofilms by CWSNs (1, 10, 100, and 200 μg/mL) under visible-light irradiation and in the dark. The biomass of the crystal violet-stained S. aureus biofilms was determined by measuring the absorbance at 590 nm. (C) CLSM images and (D) fluorescence quantification of the S. aureus biofilms after treatment with different concentrations of CWSNs. (E) Photographs of bacterial broth plates and (F) viability of S. aureus biofilms after treatment with different concentrations of CWSNs. The statistical significance of differences between the indicated groups. ****P < 0.0001.
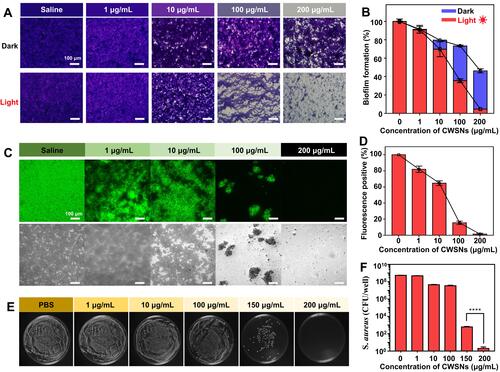
Figure 5 Treatment of S. aureus-infected wounds. (A) Photographs of the saline and CWSN gels. (B) Antibiofilm potential of the saline gel and CWSN gel in vitro. (C) Schematic diagram of the construction of the in vivo infection model and mouse treatment. (D) Photographs and (E) areas of the infected wounds on different days (0, 1, 2, 3 and 4) after saline gel or CWSN gel treatment. Microphotographs of the (F) H&E and (G) Masson’s trichrome stained slices of S. aureus-infected tissues on the 4th day posttreatment. (H) Bacterial CFUs of the infected tissues 4 days after treatments. The statistical significance of differences between the indicated groups. ****P < 0.0001.
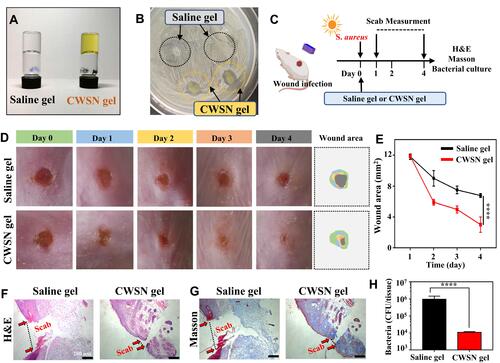
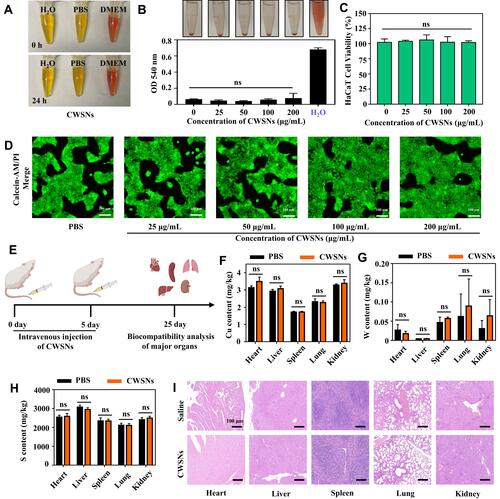
Figure 6 Biocompatibility of the CWSNs. (A) Photographs of the CWSNs dispersed in H2O, PBS, and DMEM at different time points. (B) Hemolysis ratio of fresh red blood cells (RBCs) incubated with different concentrations of CWSNs for 4 h. (C) Viability (%) of HaCaT cells after co-cultured with different concentrations of CWSNs. (D) CLSM images of HaCaT cells stained with Calcein-AM/PI after treatment with different concentrations of CWSNs. (E) Schematic illustration of the experimental procedure for determining the cytotoxicity of CWSNs in vivo. ICP-OES results for the element deposition of (F) Cu, (G) W, and (H) S, and (I) H&E stained images of the major organs (heart, liver, spleen, lung, and kidney) from the mice treated with saline and CWSNs at 25 days. The statistical differences between the indicated groups. ns, not significant.