Figures & data
Figure 1 Schematic diagram of the AiDA setup, example output data and nanoparticle recovery as a function of lung residence time. (A) Nanoparticles were electrospray-generated, size-selected and transferred to the reservoir from which the particle concentration was measured. The inhaled and exhaled nanoparticle concentrations were quantified with the same CPC. (B) Diagrams of a recorded breathing pattern and measured particle concentrations. The breathing-pattern and the inhaled and exhaled particle concentrations were analyzed to determine particle residence time in the lungs and the fraction of recovered particles after exhalation at each residence time. (C) A linear-least squares line was fitted to the recovery as a function of lung residence time, from which rAiDA and R0 were determined.
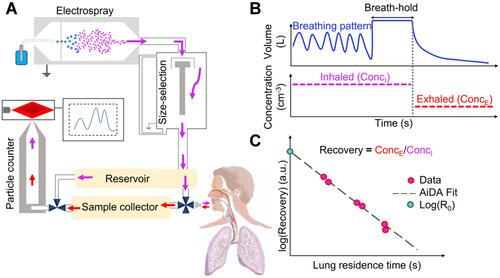
Table 1 Subject Demographics, Anthropometric Data, AiDA Measurements and Other Lung Function Examination Results. Mean, Median, Standard Deviations and Inter Quartile Range (the Difference Between Quartile 3 and Quartile 1), for the Study Population are Presented
Figure 2 The rAiDA and R0 distributions for the 695 participants. (A) The rAiDA distribution is skewed, largely due to the outliers at rAiDA >400. Note that one participant had an rAiDA value close to 600 µm. (B) The R0 distribution approached a normal distribution with a mean recovery of 50% at an imaginary zero seconds breath-hold.
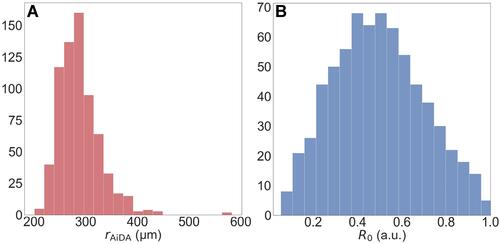
Table 2 Spearman’s Rank Coefficient (ρ) with Associated P-values, for AiDA Variables rAiDA and R0, with Age, Weight, Height, Waist and Pack-Years (Left). Simple (Unadjusted) Linear Regression of rAiDA and R0 on Age, Weight, Height, Waist and Pack-Years (Right). For the Regression, β-Coefficients, Standard Errors (SE), 95% Confidence Intervals (CI) and P-values are Given. The Level of Significance is Indicated with Asterisk According to P < 0.0001 (****), 0.0001 ≤ P < 0.001 (***), 0.001 ≤ P < 0.01 (**) and P < 0.05 (*)
Table 3 Spearman’s Rank Coefficient (ρ) with Associated P-values, Between AiDA Variables rAiDA and R0, and Lung Function Measurements (Left), with No Adjustment for Confounders. Coefficients, Standard Errors (SE), 95% Confidence Intervals (CI) and P-value for the Multiple Regression Model of rAiDA and R0 on VC, FEV1/VC, DLCO, R5, R5-R20, X5, AX, Fres, VOL, LAV and PD15, Adjusted for Age and Height (Right). The Level of Significance is Indicated with Asterisk According to P < 0.0001 (****), 0.0001 ≤ P < 0.001 (***), 0.001 ≤ P < 0.01 (**) and P < 0.05 (*)
Figure 3 Explained variance per PC. The black line marks the cumulative explained variance while the bars show the explained variance per PC. Together the first five PCs explained 83% of the variance in the data, with each PC explaining 39%, 20%, 10%, 8% and 6% respectively, in descending order.
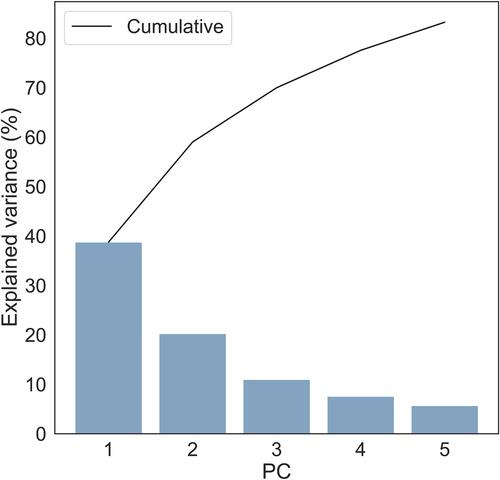
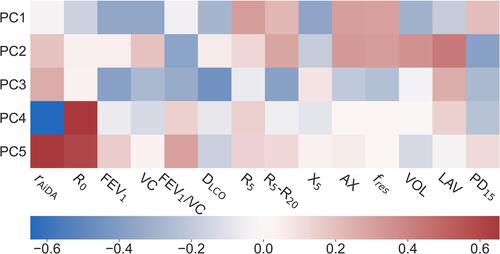
Figure 4 Heat map on the principal component factor loading for the first five PCs. The heatmap shows that the AiDA variables are not important components of the first two PCs, rAiDA is important for PC3, and rAiDA and R0 are the dominating contributors to PC4 and PC5, with relatively low contributions from all other lung function variables. The variance in the data explained by PC4 and PC5 (14% of the variance in the data) is mainly explained by the AiDA variables.