Figures & data
Scheme 1 (A) Synthesis route of the pH-responsive prodrug copolymer HA-DAS. (B) Illustration of the HDO-NPs system for tumor therapy in vivo.
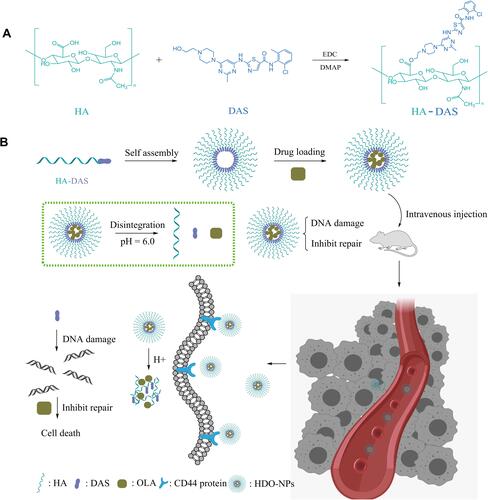
Figure 1 (A) Acid hydrolysis mechanism of HA-DAS. (B) Acid-triggered dissociation of DAS from HA-DAS was detected by HPLC.
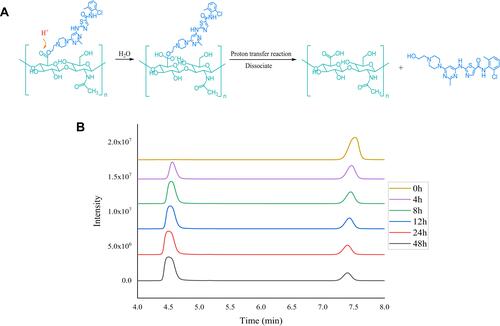
Table 1 Size, PDI, Zeta Potentia, DL and EE of the HDO-NPs
Figure 2 (A) Size distribution of HDO-NPs by DLS. (B) TEM images of HDO-NPs. Scale bar: 50 nm.
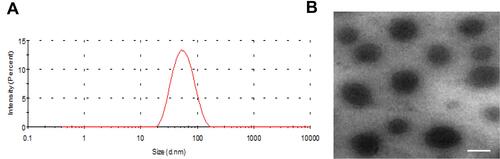
Figure 3 The in vitro stability of HDO-NPs was reflected by (A) size and (B) PDI at pH 6.0 and pH 7.4. The (C) size and (D) PDI at different concentrations were selected to determine the dilution stability of HDO-NPs.
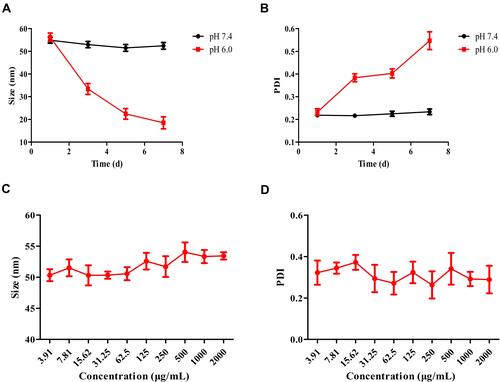
Figure 4 In vitro (A) DAS and (B) OLA release profiles of HDO-NPs at pH 7.4, pH 6.0 and pH 4.0.
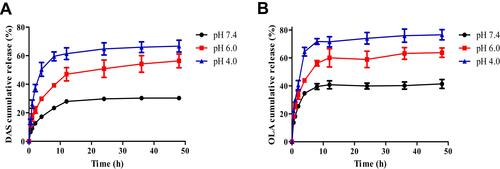
Figure 5 Images of the cellular uptake of C6, HA + HA-DAS/C6 (receptor blocking group) and HA-DAS/C6 against MDA-MB-231 cells at 1 h and 4 h. Scale bar = 50 μm.
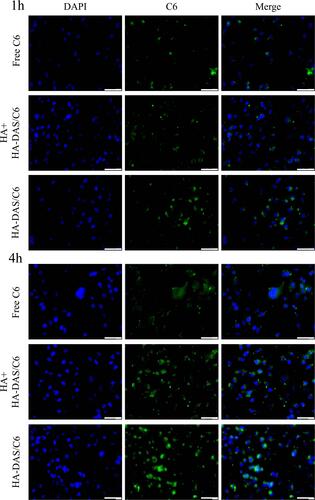
Figure 6 The accumulation of (A) DAS and (B) OLA in MDA-MB-231 cells incubated with DAS + OLA, HA + HDO-NPs and HDO-NPs for different times.
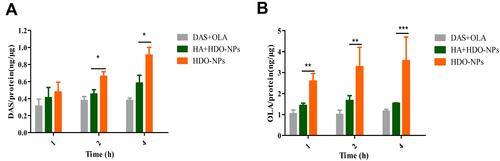
Figure 7 The transport of HDO-NPs in MDA-MB-231 cells. Scale bar = 20 μm.
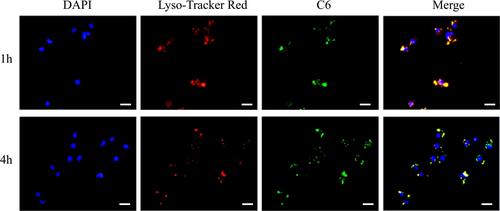
Table 2 The Statistical Analysis of Cell Viabilities of MDA-MB-231 Cells Treated with Free DAS, OLA, DAS + OLA and HDO-NPs for 24 h and 48 h
Table 3 In vitro Cytotoxicity of MDA-MB-231 Cells After 24 h and 48 h Incubation with Different Drug Formulations as Determined by MTT Assay
Figure 8 In vitro cytotoxicity analysis of MDA-MB-231 cells after (A) 24 h and (B) 48 h of treatment with free DAS, OLA, DAS + OLA and HDO-NPs. The cell viabilities were determined by MTT cytotoxicity assay. (C) Fluorescent micrographs depicting the cytotoxicity of different drugs. Green represents living cells, and red represents dead cells.
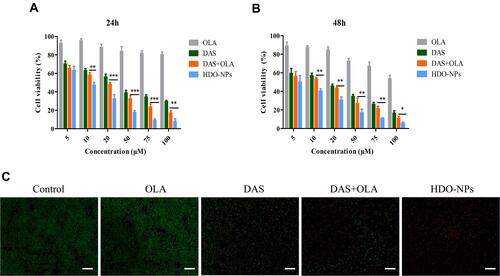
Figure 9 (A) Photographs of the red blood cell hemolysis assay of HDO-NPs with different concentrations, using normal PBS and water as the negative and positive controls. (B) Hemolysis rates of HDO-NPs with different concentrations. In vivo fluorescence imaging of MDA-MB-231 tumors at different time points after intravenous injection (C) and (D) fluorescence imaging of isolated organs and tumor tissues 24 h after intravenous injection (the upper panel shows free Cy5, and the lower panel shows HA-DAS/Cy5).
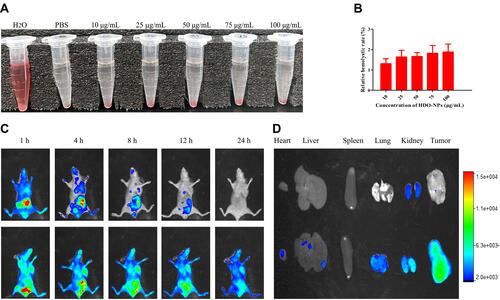
Figure 10 Therapeutic effects in vivo. (A) Schematic illustration of the in vivo therapeutic process. Images of isolated tumors (B) and tumor volume changes (C) of mice in each group during the treatment period. Tumor volume (D), tumor weight (E) and TGI (F) in each group after the end of treatment. (G) The average body weight of mice was used to evaluate the toxicity of the different treatments.
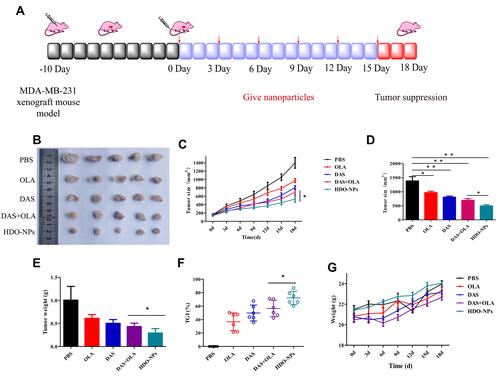
Figure 11 HE staining, Ki-67 staining, and γ-H2AX staining of tumors after different treatments. Scale bar = 50 μm. The red circles indicate apoptotic tumor sites.
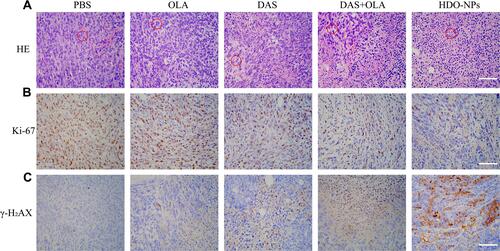
Figure 12 In vivo toxicology examination of mice treated with HDO-NPs. Serum biochemistry data of liver function markers, including (A) alanine aminotransferase (ALT) and (B) aspartate aminotransferase (AST). (C) Blood urea nitrogen (BUN) and (D) creatinine (CRE) of the hematology assay.
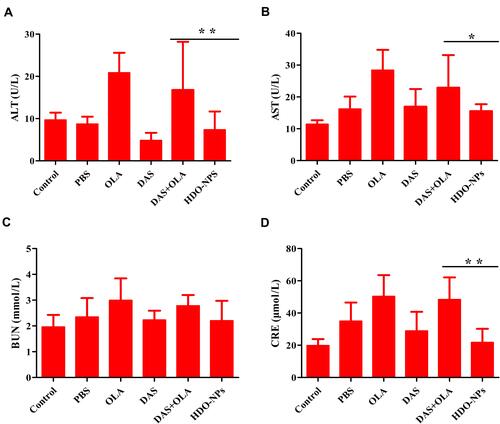
Figure 13 HE staining of various organs in BALB/c nude mice harboring MDA-MB-231 tumor xenografts after different treatments. Scale bar = 200μm. The red circles indicate the sites of organ damage.
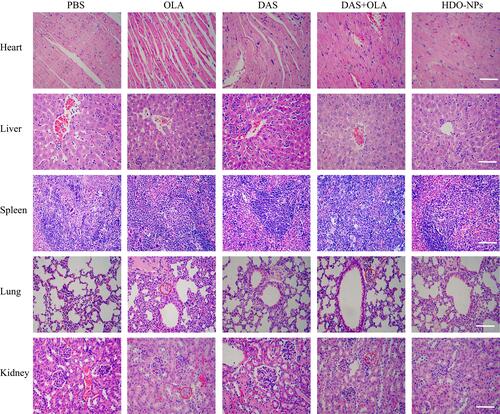
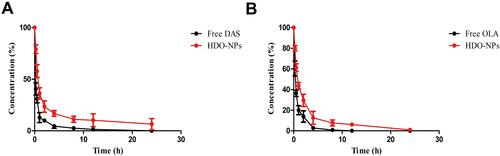
Table 4 The Pharmacokinetic Parameters of DAS a) and OLA b) After Injection of HDO-NPs and DAS + OLA
Figure 14 (A) Pharmacokinetics of DAS in free DAS and HDO-NPs. (B) Pharmacokinetics of OLA in free OLA and HDO-NPs.