Figures & data
Table 1 Effect of Different Concentrations of Polysorbate 80 on Particle Size, Polydispersity Index, and Zeta Potential of Different NLC Placebos (Mean ± SD, n = 3)
Table 2 Effect of Total Lipid to Polysorbate 80 Ratio (2:1 and 3:1) on Particle Size, Polydispersity Index, and Zeta Potential of NLC Placebos, Composed of Glyceryl Distearate and Oleic Acid (Mean ± SD, n = 3)
Table 3 Effect of Liquid Lipid on Particle Size, Polydispersity Index, Zeta Potential, % Drug Content, and % Entrapment Efficiency (Mean ± SD, n = 3)
Figure 1 (A) particle size (PS), (B) polydispersity index (PDI), (C) zeta potential (ZP), (D) drug content of ciprofloxacin and natamycin, and (E) entrapment efficiency (EE) of ciprofloxacin and natamycin for F1 formulation over three months storage at 4°C and 25°C (mean ± SD, n = 3).
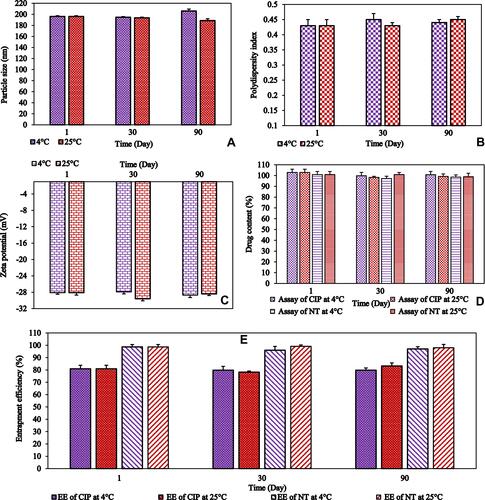
Table 4 The Viscosity of F1 and F1-IG Formulations with Different Gellan Gum Concentrations (mean±SD, n = 3)
Figure 2 Viscosity of F1-IG2 formulation in the presence and absence of STF following one-month storage at 25°C (mean ± SD, n = 3).
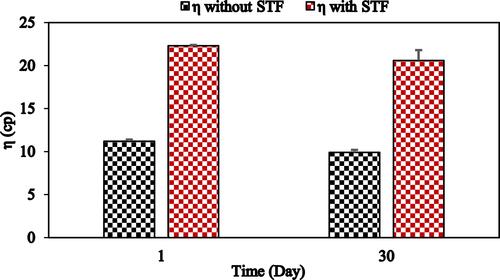
Figure 3 FTIR spectra of (A) ciprofloxacin, (B) natamycin, (C) oleic acid, (D) Glyceryl distearate, (E) physical mixture (ciprofloxacin, natamycin, oleic acid and glyceryl distearate), (F) placebo NLC (P4), and (G) NLC formulation (F1).
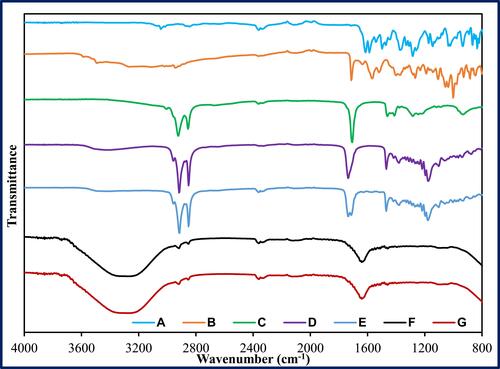
Figure 4 Transmission electron micrographs of F1 (A) and F1-IG2 (B) formulations.
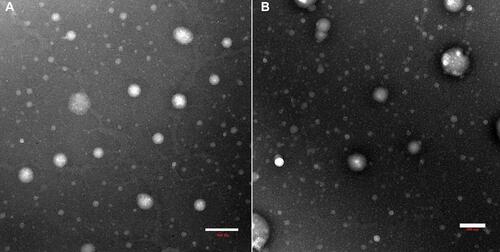
Figure 5 In vitro release of ciprofloxacin and natamycin from F1, F1-IG2, NT-C, and CIP-HCL-C formulations through thermo scientific™ slide-A-lyzer™ MINI dialysis device (10K MWCO) (mean ± SD, n = 3).
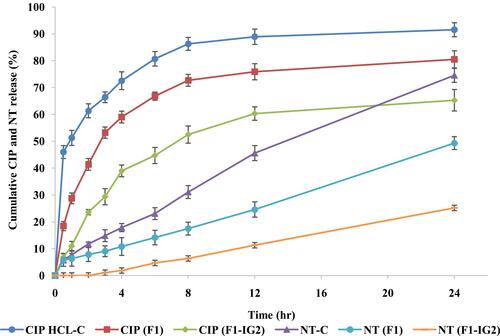
Table 5 Mathematical Model Fitting of Release Kinetics of Ciprofloxacin and Natamycin from F1 and F1-IG2 Formulations (Mean ± SD, n = 3)
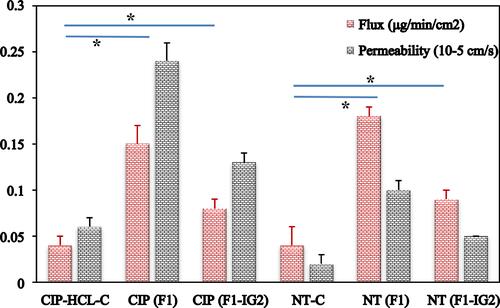
Figure 6 Transcorneal flux and permeability of ciprofloxacin and natamycin from F1, F1-IG2, NT-C, and CIP-HCl-C formulations through the isolated rabbit cornea (mean ± SD, n = 3, *; means significant difference compared to control formulation).