Figures & data
Figure 1 Microglia activation and cytokine release in RB photothrombosis: (A) Photothrombosis is achieved via i.p. injection of RB and illumination of the sensory motor cortex through a cranial window. (B) Quantification of infarct volume and wire hang test. (C) Representative photographs of whole brain stained with TTC, and whole brain 24 hours after initiating the model. (D) Brain tissues were immunostained with anti-Iba-1 antibodies. (E) Total RNA was isolated from the infarct region of the ipsilateral brain, and used for cDNA synthesis. The mRNA levels of TNF-α, IL-1β, Cox2, IL-6, and iNOS were determined by qRT-PCR in all groups.
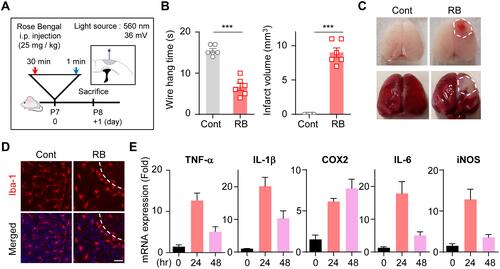
Figure 2 AAV-EF1α-mCherry-PLGA NPs were i.t. administered to cisterna magna: (A) On day 3 after injection, tissue of brain was isolated and used for immunostaining with anti-Iba-1, GFAP, and NeuN antibodies. The images of red fluorescence were obtained only with the expression of mCherry observed in each cell type. (B) The volume of mCherry fluorescence was quantified using the IMARIS program.
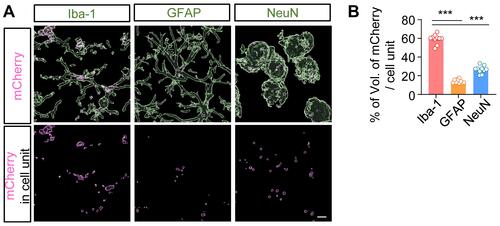
Figure 3 Characterization and cytotoxicity of PER encapsulated in PLGA NPs. (A) These PER-loaded PLGA NPs were prepared by sonicating a mixture of rhodamine-conjugated PLGA and PER. The NP size (B) and zeta potential (C) of the PER NPs. (D) BV2 cells were treated with Rho-PER NPs, and incubated for 3 hours. BV2 cells were incubated with PER itself (E) or PER NPs (F) for 24 hours. (G) Scanning electron microscopy images of nanoparticle films. Scale bar: 500 nm. (H) PER NPs were hydrolyzed by rolling in PBS for 5 days. The PER released into the suspension phase was observed by measuring the absorbance at a wavelength of 295 nm with a spectrometer.
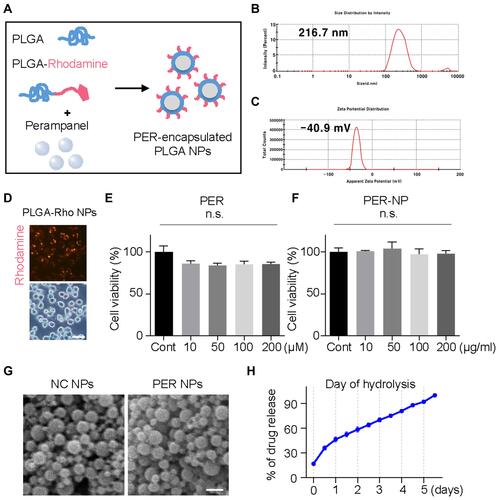
Figure 4 Microglia targeted by PER encapsulated in PLGA NPs attenuate infarct damage in the RB model, and reduce production of pro-inflammatory cytokines: (A) Wire hang test evaluated 24 h after RB photothrombosis. (B) Representative images of coronal brain sections stained with TTC. (C) Quantitative analysis of infarction volume. (D) Hematoxylin and eosin (H&E) staining of brain tissue sections of rat models of cerebral ischemia. Scale bar: 100 nm. (E) Cresyl violet staining of brain sections showed the infarct volume after 1 days of Rose Bengal modeling. Scale bar: 100 nm (F) Representative images of TUNEL staining in the cortical core infarct and penumbra within tissue collected after 24 h of Rose Bengal photothrombosis. Scale bar: 200 nm (G) The mRNA levels of TNF-α, IL-1β, Cox2, IL-6, and iNOS were measured using qRT-PCR. (H) Western blot analysis of Ym1, Arg1, Iba-1, CD206, and ACTB levels in cortical tissue of hemisphere subjected to 24 h of RB-induced photothrombosis.
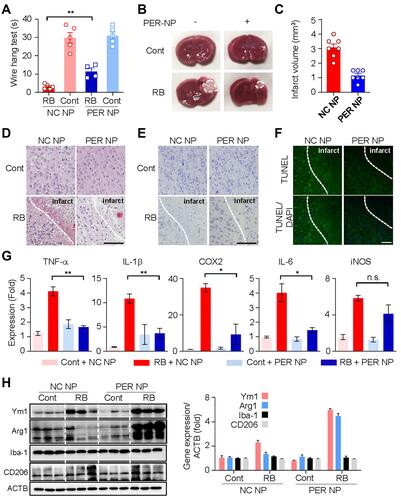
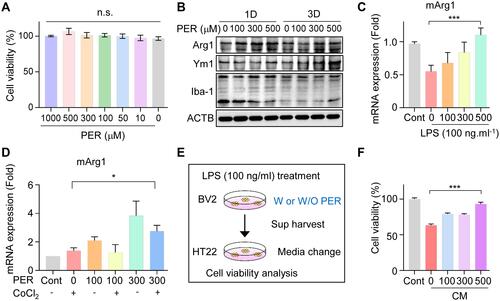
Figure 5 PER increases M2 microglial polarization and mediates neuroprotection in BV2 cells: (A) Dose-dependent cell viability was measured by treating with PER. (B) The related M2 microglial polarization was confirmed by Western blotting for Arg1, Ym1, and Iba-1 at 1 day and 3 days after PER treatment. (C) After PER treatment for 24 hours, mArg1 mRNA levels were checked in LPS-treated BV2 cells. (D) Microglial BV2 cells were co-treated with PER and CoCl2, and incubated for 24 hours. Then, the mRNA level of Arg1 was measured by qRT-PCR in the absence or presence of PER. (E) BV2 cells were treated with LPS for 24 hours with and without PER to make CM and the medium was used to treat HT22. (F) Cytotoxicity after incubation of HT22 cells with BV2-CM for 24 hours.