Figures & data
Table 1 Correlation Between the Clinicopathologic Variables and the Four Key Genes mRNA Expression in Cervical Cancer
Figure 1 Properties of MNP in cervical cancer cells. (A and B) TEM images of MNPs in 25,000× (A), 80,000× (B), 600,000× (C). (D) MNP exhibited room temperature superparamagnetism with good magnetic field responsivity towards the external magnet. Effect of the MNP on the viability of the HeLa (E and F) and SiHa (H and I) cells via the MTT assay. Cells were treated with MNP for 0–72h at a concentration range 0–400μg/mL, H2O2 (0.5mM) were employed as positive control. HeLa (G) and SiHa (J) cells treated with MNP (100μg/mL) for 24 and 72 h were stained with FITC-labeled annexinV/PI and subsequently subjected to flow cytometry analysis.
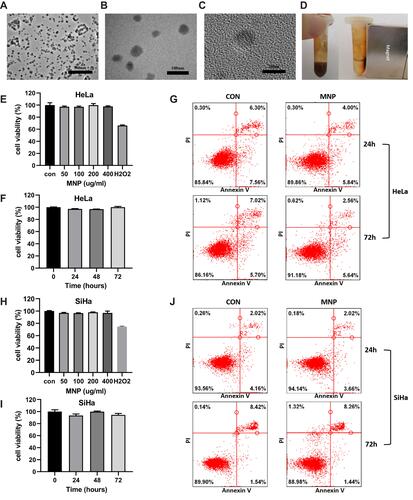
Figure 2 Biological effects of MNP in lysosome of cervical cancer cells. (A) Colocalization of MNP-C6 with lysosomes in HeLa cells. Gray-value calculation and quantitative colocalization analysis was carried out using ImageJ software. CTSB activity in HeLa (B) and SiHa (C) cells was measured as RFU with CTSB substrate Z-FR-AMC. After MNP treatment, CTSB activity decreased significantly (p<0.001). Fluorescence value of lysotracker decreased obviously after MNP treatment in HeLa (D) and SiHa (E) cells. HeLa (F) and SiHa (G) cells treated with MNP exhibit a shift of granular red fluorescence to diffused green fluorescence of AO. Images at 1000× magnification were also shown (row 2, 4). Scale bar = 20 μm. ***p < 0.001.
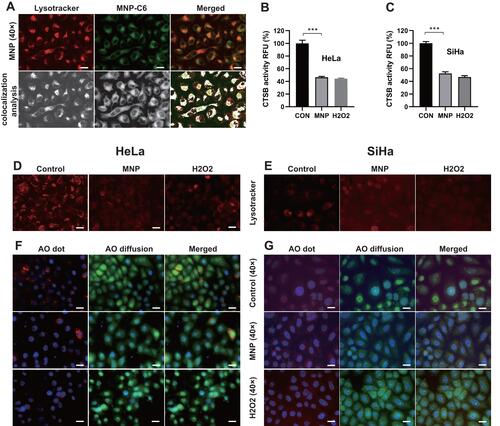
Figure 3 Four key genes were associated with overall survival time and clinical features in cervical cancer patients. Survival analysis of PPFIA4 (A), SMAD7 (B), IL1B (C), and PTK2B (D) expression levels associating with overall survival time in 310 TCGA cervical cancer patients using Kaplan–Meier curves. The patients were divided into 2 groups, based on median gene expression value as a cut-off point. (E–G) The expression of PPFIA4 was highly associated with clinical stage with a p value of 2e-7 (E), and tumor (T) classification with a p value of 7.7e-06 (F). The expression of IL1B was significantly associated with tumor (T) classification with a p value of 0.0072 (G). The association between genes expression level and clinical features was estimated by Kruskal–Wallis test. (see also Figure S2).
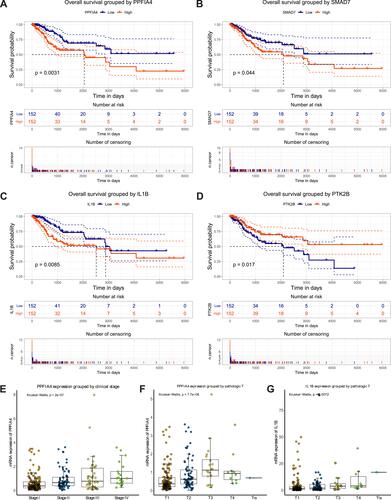
Figure 4 Somatic mutations of four key genes that were detected in the TCGA cervical cancer patients. (A) Oncoplot showed somatic mutation patterns of the four key genes. Each column in the figure represented an individual cancer sample. (B and C) Plots showed mutation distribution and the protein domains for the mutated proteins of PPFIA4 (B) and PTK2B (C). (D) Top 30 most recurrent mutated genes in cervical cancer patients were represented. The bar plot on the top panel represented the total number of mutations. (E) PPFIA4 and PTK2B were in significant co-occurrence of mutation with 7 of the top mutated genes (□). p < 0.05; *p < 0.01.
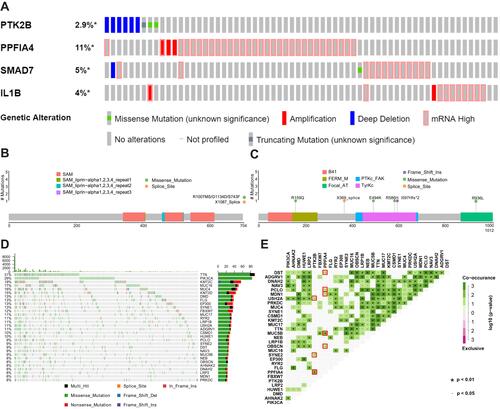
Figure 5 Correlations of key genes expression with immune infiltration level in TCGA cervical cancer patients. (A) PTK2B expression was significantly negatively related to tumor purity, and had significant positive correlations with infiltrating levels of CD8+ T cells, neutrophils, and dendritic cells in cervical cancer patients. (B) PPFIA4 expression had significant negative correlations with infiltrating levels of CD8+ T cells. (C) SMAD7 expression had weak positive correlations with infiltrating levels of neutrophils and dendritic cells, and a weak negative correlation with tumor purity. (D) IL1B expression had significant positive correlations with infiltrating levels of neutrophils and dendritic cells. Each dot represented a single tumor sample.
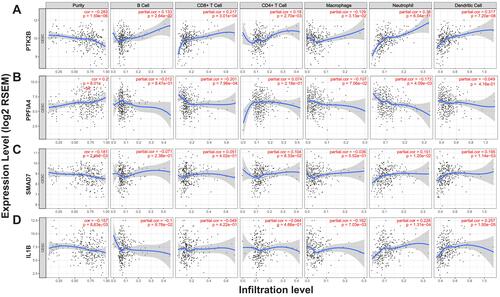
Figure 6 Correlations of key genes with lysosome. GSEA results showed KEGG term “lysosome” is differentially enriched for the expression of PTK2B (A) and PPFIA4 (B) in cervical cancer. (C) PPFIA4 and PTK2B were in significant co-occurrence of mutation with 26 lysosomal genes in KEGG term “lysosome” gene set. (D–F) Correlation analyses of gene expression levels were also performed, and strong correlations between key genes and certain lysosomal genes were observed. The results were displayed as Pearson’s correlation coefficient bubble-plots (D), heatmap (E) and lysosomal genes with top highest Pearson’s r with key genes were shown in scatter-plots (F).
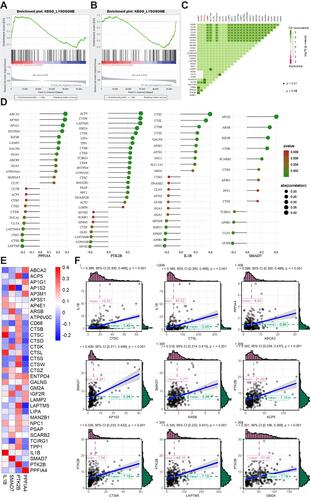
Figure 7 Network of key genes and anti-cancer drugs. The network contained 50 genes (4 key genes and their 46 most frequently altered neighbor genes). Relationships between these genes and anti-cancer drugs (hollow hexagon) were also illustrated. Yellow hexagons indicate the FDA approved anti-cancer drugs. PTK2B and IL1B were the targets of anti-cancer drugs including genistein, leflunomide and gallium nitrate.
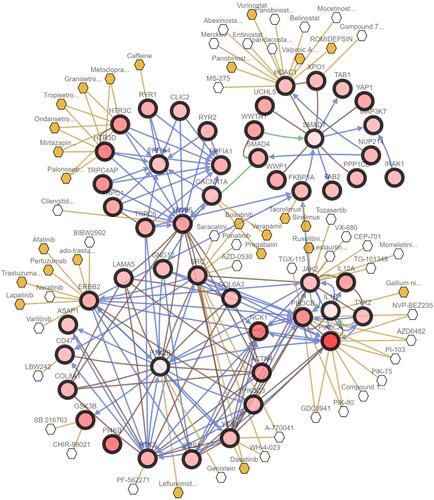
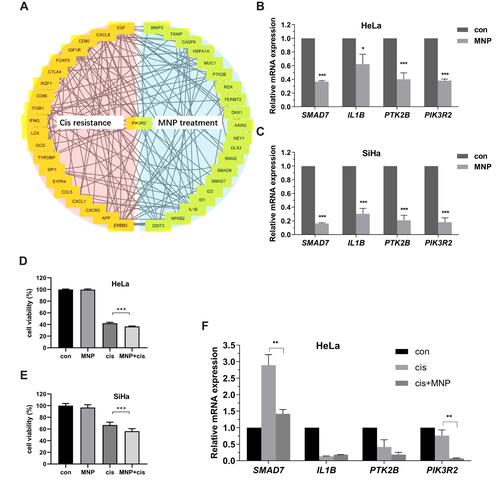
Figure 8 PIK3R2 as a common hub genes in MNP treatment and cisplatin resistance (A). mRNA expression levels of key genes in HeLa (B) and SiHa (C) cells by qRT-PCR. Synergistic killing effects of MNP with cisplatin in HeLa (D) and SiHa (E) cells using MTT assay. (F) mRNA expression levels of key genes after combination of cisplatin and MNP in HeLa cells by qRT-PCR. Data were presented as mean ± SEM. *p < 0.05; **p < 0.01; ***p < 0.001.