Figures & data
Figure 1 Synthetic scheme of OTMCS–PEI. First the N-octyl-N-quatenary chitosan (OTMCS) was synthesized. Then the OTMCS was crosslinked with PEI by N-hydroxysuccinimide.
Abbreviation: OTMCS–PEI, amphiphilic chitosan cross-linked with low-molecular weight polyethylenimine.
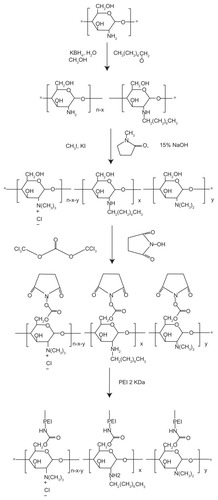
Figure 2 Representative 1H NMR spectra of (A) chitosan, (B) OTMCS, (C) PEI, and (D) OTMCS–PEI, in D2O at room temperature.
Abbreviations: OTMCS, amphiphilic chitosan; PEI, low-molecular weight polyethylenimine; OTMCS–PEI, amphiphilic chitosan cross-linked with low-molecular weight polyethylenimine; D2O, deuterium oxide.

Figure 3 Determination of the buffering capacity of PEI 25 KDa and the OTMCS–PEI polymer by acid-base titration.
Note: Solution containing the polymer (0.2 mg/mL) was adjusted to pH 10.0, and then titrated with HCl from 10.0 to 3.0.
Abbreviation: OTMCS–PEI, amphiphilic chitosan cross-linked with low-molecular weight polyethylenimine.
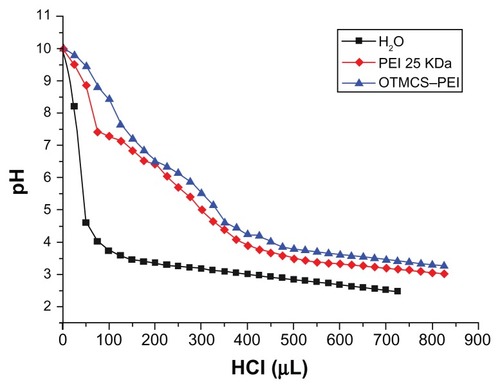
Figure 4 Degradation of OTMCS–PEI.
Notes: The polymer was dissolved in 0.1 M PBS (pH = 7.4) and incubated at 37°C and 100 rpm. Determination of molecular weight (MW) was measured by gel permeation chromatography with multiangle laser light scattering (GPC-MALLS) (n = 3).
Abbreviations: OTMCS–PEI, amphiphilic chitosan cross-linked with low-molecular weight polyethylenimine; PBS, phosphate-buffered solution.
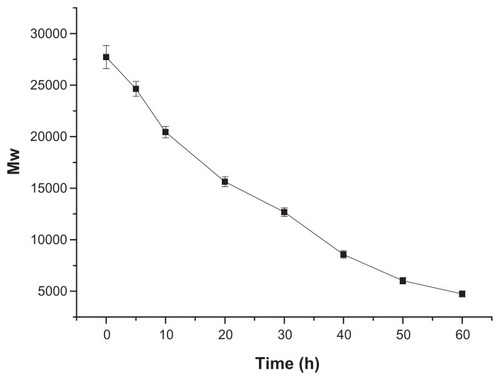
Figure 5 (A) Particle sizes (nm) of the OTMCS–PEI/DNA complex at w/w ratios of 5, 10, 20, and 40. (B) Zeta potentials (mV) of the OTMCS–PEI/DNA complex at w/w ratios of 5, 10, 20, and 40. The data were expressed as mean values (±standard deviations, n = 3). (C) Transmission electron micrograph of OTMCS–PEI/DNA nanoparticles.
Abbreviation: OTMCS–PEI, amphiphilic chitosan cross-linked with low-molecular weight polyethylenimine.

Figure 6 (A) Agarose gel electrophoresis of the OTMCS–PEI/DNA complex at various w/w ratios. Protection of OTMCS–PEI on plasmid DNA. (B) Protection of plasmid DNA from degradation by DNase I at different concentrations of 0, 0.375, 0.75, 1, 1.5, 2.25, and 3 U DNase I/μg DNA. (C) Protection of plasmid DNA from dissociation by serum at varying concentrations of 10%, 25%, and 50%. The lanes 10%, 25%, and 50% without “+” refer to the presence of naked DNA with 10%, 25%, and 50% serum; the lanes 10%, 25%, and 50% with “+” refer to the presence of OTMCS–PEI/DNA complex at w/w ratio 20 besides 10%, 25%, and 50% serum. (D) Protection of plasmid DNA from dissociation by sodium heparin at varying concentrations of 700, 800, 900, 1000, 1100, and 1200 μg/mL.
Abbreviation: OTMCS–PEI, amphiphilic chitosan cross-linked with low-molecular weight polyethylenimine.
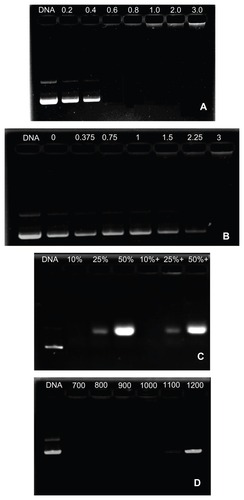
Figure 7 Cytotoxicity of OTMCS–PEI at various concentrations in HeLa cell lines using the MTT assay.
Notes: The data were expressed as mean values (±standard deviations, n = 3); **P < 0.01.
Abbreviations: OTMCS–PEI, amphiphilic chitosan cross-linked with low-molecular weight polyethylenimine; MTT, 3-(4,5-dimethyl-thiazol-2-yl)-2,5-diphenyl tetrazolium bromide.
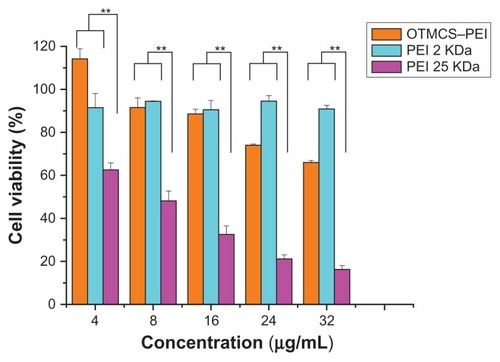
Figure 8 GFP gene transfection in HeLa cells by OTMCS–PEI at w/w ratios of 5, 10, 20, and 30. (A) Percentage of GFP gene transfection in HeLa cells by flow cytometry analysis.* (B) Representative fluorescence images for s transfection in HeLa cells using OTMCS–PEI at various w/w ratios.
Note: *The mean ± standard deviation, n = 6.
Abbreviations: GFP, green fluorescent protein; OTMCS–PEI, amphiphilic chitosan cross-linked with low-molecular weight polyethylenimin.
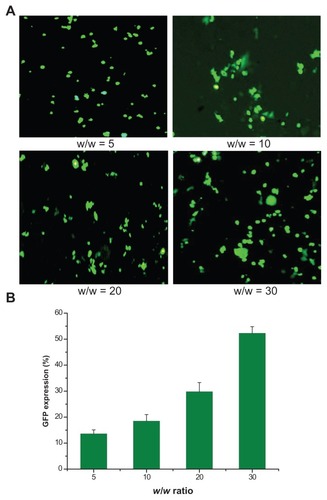
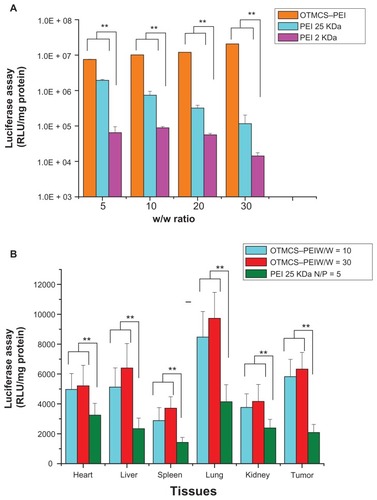
Figure 9 (A) Transfection efficiency of OTMCS–PEI/DNA complex in HeLa cell line at w/w ratios of 5, 10, 20, and 30.* (B) Transfection efficiency of pGL3-Control as a reporter gene in mice.
Notes: BALB/c athymic mice were inoculated with B16 cells. Luciferase gene expression was determined after administration of OTMCS–PEI/DNA complex (w/w = 10) OTMCS–PEI/DNA complex (w/w = 30), and PEI 25 KDa/DNA complex (N/P = 5);† *each data point represents the mean ± standard deviation (n = 6); **P < 0.01; †results were expressed in RLU/mg protein.
Abbreviations: OTMCS–PEI, amphiphilic chitosan cross-linked with low-molecular weight polyethylenimine; RLU, relative light units.