Figures & data
Figure 1 Combination index of PTX and CBP in SKOV-3 cells and characterization of liposomes. (A) Cell viability and (B) combination index treated with various ratios of PTX/CBP against SKOV-3 cells for 48 h. The data were presented as the mean ± SD (n = 3). ***p < 0.001, ****p < 0.0001. Size distribution graph of different liposome formulations, including (C) Lip-PTX/CBP, (D) ES-Lip-PTX/CBP, (E) PEG-Lip-PTX/CBP, and (F) ES-PEG-Lip-PTX/CBP. (G) Transmission electron microscopy image of ES-PEG-Lip-PTX/CBP. Scale bar: 200 nm.
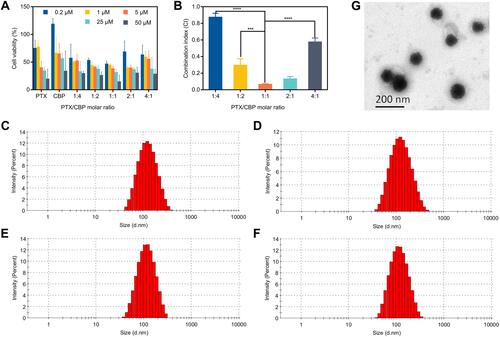
Table 1 Average Size, PDI and Zeta Potentials of Different Liposome Formulations
Table 2 Encapsulation Efficiency and Drug Loading of Different Liposome Formulations
Figure 2 Stability study of different liposome formulations. (A) The particle size, PDI and (B) zeta potential variation of ES-PEG-Lip-PTX/CBP at 4°C for 28 days. The variations of (C) PDI, zeta potential and (D) particle size of ES-PEG-Lip-PTX/CBP in PBS, PBS + 10% serum and medium + 10% serum.
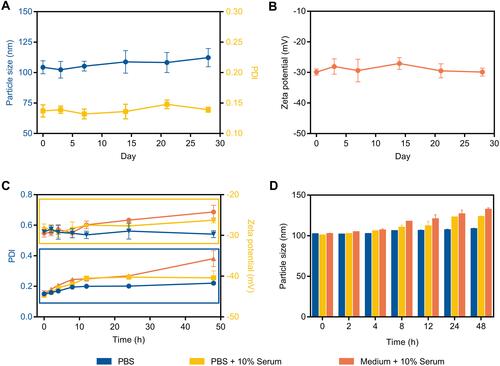
Figure 3 Leakage rate study. At 4°C, encapsulation efficiency changes of (A) PTX and (B) CBP in different liposome formulations. At 25°C, encapsulation efficiency changes of (C) PTX and (D) CBP in different liposome formulations. The data were presented as the mean ± SD (n = 3).
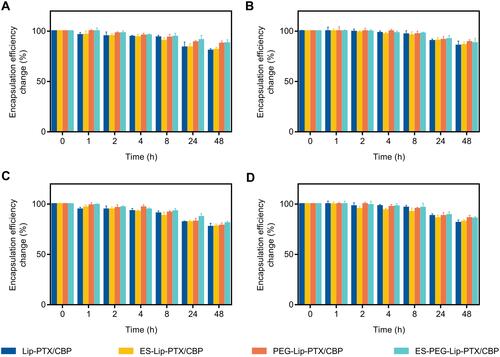
Figure 4 Cumulative release of (A) PTX and (B) CBP from different liposome formulations at pH 7.4. Cumulative release of (C) PTX and (D) CBP from ES-PEG-Lip-PTX/CBP at pH 5.5. The data were presented as the mean ± SD (n = 3). *p < 0.05, **p < 0.01, ***p < 0.001, ****p < 0.0001.
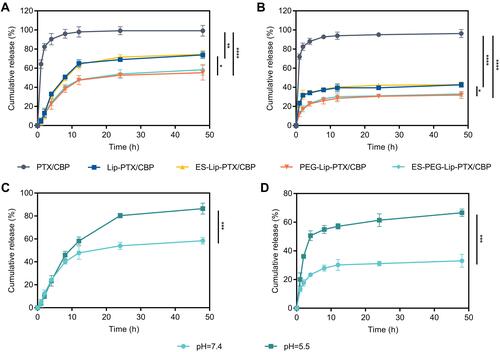
Figure 5 The in vitro cytotoxicity of different liposome formulations on SKOV-3 cells. Cell viability and IC50 values of SKOV-3 cells after treatment with various liposome formulations at (A and D) 24 h, (B and E) 48 h and (C and F) 72 h. The data were presented as the mean ± SD (n = 3). *p < 0.05, **p < 0.01, ***p < 0.001, ****p < 0.0001.
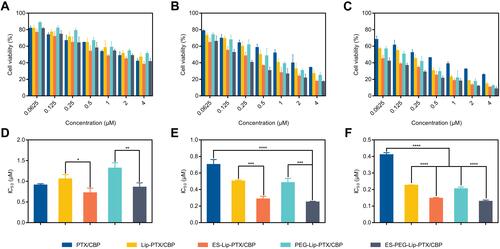
Figure 6 Cellular uptake of Rh B-loaded liposome formulations or free Rh B on SKOV-3 cells after (A) 1 h, (B) 2 h, (C) 3 h and (D) 4 h of incubation, measured by fluorescence microscope. Scale bar: 50 μm.
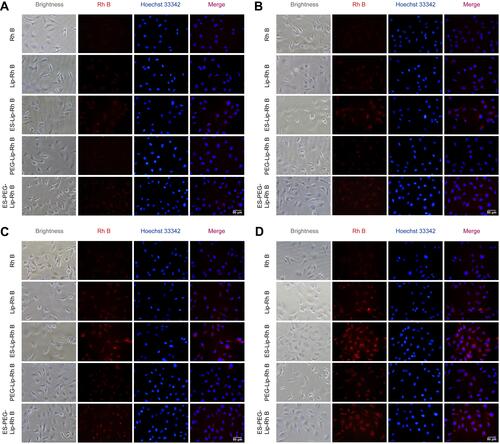
Figure 7 In vitro uptake mechanism. (A) Cellular uptake of ES-PEG-Lip-Rh B in SKOV-3 cells after pre-treated with ES, amiloride, genistein and sucrose. Scale bar: 50 μm. (B) Mean fluorescence intensity quantified by Image J. ****p < 0.0001.
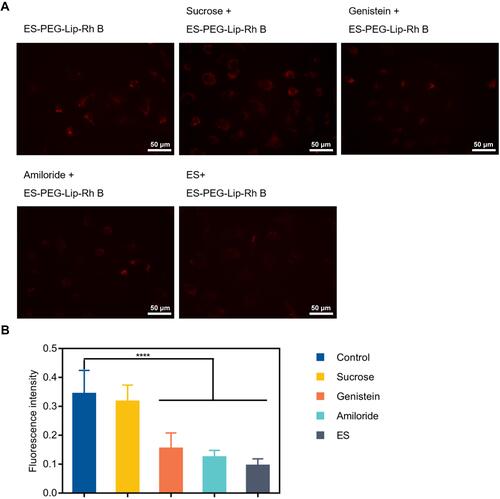
Figure 8 In vivo targeting study. (A) Distribution of DiR-loaded liposome formulations monitored via the IVIS spectrum at different time points. (B) The quantification of DiR fluorescence intensity at tumor sites in vivo. (C) Ex vivo images of the heart, liver, spleen, lungs, kidneys, and tumor. (D) Relative fluorescence intensity of the excised tumors (n = 3). N.S. p > 0.05, *p < 0.05, **p < 0.01, ***p < 0.001, ****p < 0.0001.
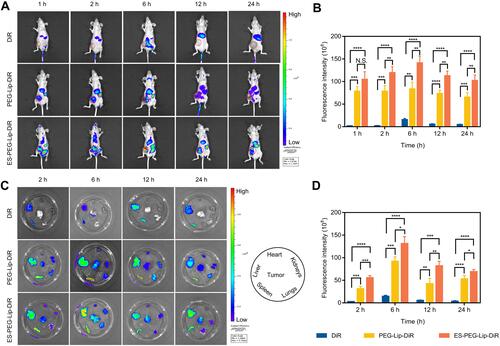
Table 3 Pharmacokinetic Parameters of PTX in Mice After Intravenous Administration at a Dose of 18.0 mg/kg
Table 4 Pharmacokinetic Parameters of CBP in Mice After Intravenous Administration at Dose of 7.8 mg/kg
Figure 9 Plasma concentration–time curve of (A) PTX and (B) CBP in ICR mice after intravenous administration of PTX/CBP, Lip-PTX/CBP and ES-PEG-Lip-PTX/CBP at a dose of PTX of 18.0 mg/kg and CBP of 7.8 mg/kg. The data were presented as the mean ± SD (n = 3).
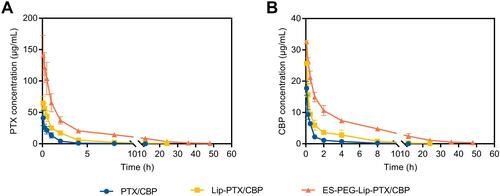
Figure 10 Tissue distribution of PTX in ICR mice, including (A) heart, (B) liver, (C) spleen, (D) lungs and (E) kidneys, after intravenous administration of PTX/CBP, Lip-PTX/CBP, and ES-PEG-Lip-PTX/CBP at a dose of PTX of 18.0 mg/kg and CBP of 7.8 mg/kg. (F) Area under the curve of PTX in different organs in ICR mice. The data were presented as the mean ± SD (n = 3). *p < 0.05, **p < 0.01, ***p < 0.001, ****p < 0.0001.
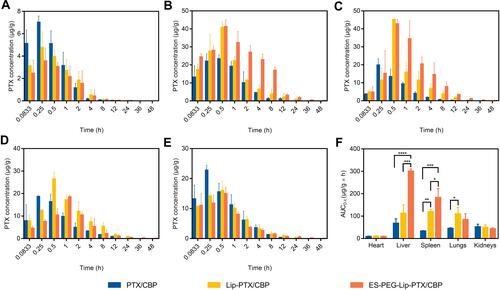
Figure 11 Tissue distribution of CBP in ICR mice, including (A) heart, (B) liver, (C) spleen, (D) lungs, and (E) kidneys, after intravenous administration of PTX/CBP, Lip-PTX/CBP, and ES-PEG-Lip-PTX/CBP at a dose of PTX of 18.0 mg/kg and CBP of 7.8 mg/kg. (F) Area under the curve of CBP in different organs in ICR mice. The data were presented as the mean ± SD (n = 3). *p < 0.05, **p < 0.01, ***p < 0.001, ****p < 0.0001.
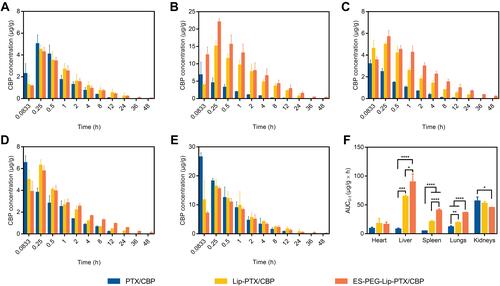
Figure 12 Anti-tumor efficacy study in vivo. (A) SKOV-3 cell inoculation and treatment schedule. (B) Tumor growth curves of different formulations. (C) Photographs of tumors in NU/NU mice treated for twenty-eight days. (D) Tumor weight and (E) tumor inhibition rate at the endpoint of experiment. (F) H&E staining of tumors tissues on the twenty-eight days’ treatment. Scale bar: 100 μm. The data were presented as the mean ± SD (n = 5). *p < 0.05, **p < 0.01, ***p < 0.001, **** p < 0.0001.
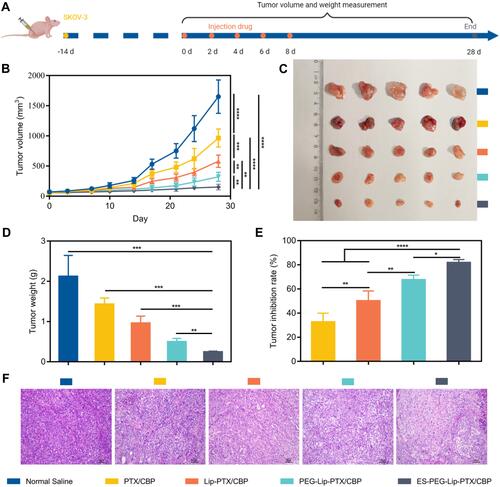
Figure 13 Anti-tumor efficacy study in vivo. (A) Body weight change curves post-injection of different formulations. (B) The organ coefficients of NU/NU mice at the end of the experiment. (C) H&E staining results of main organs after the treatment. Scale bar: 100 μm. Blood routine analysis results of (D) WBC, (E) RBC, (F) PLT and (G) HGB. Biochemical analysis results of (H) BUN, (I) Cre, (J) ALT, and (K) AST. The data were presented as the mean ± SD (n = 5).
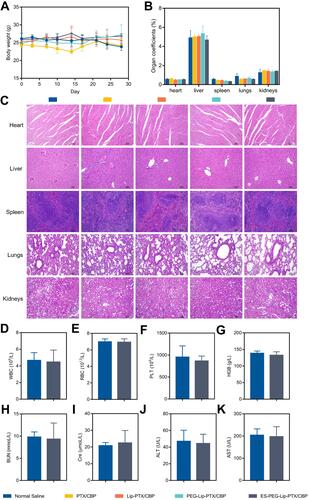
Table 5 LD50 of PTX/CBP, Lip-PTX/CBP, and ES-PEG-Lip-PTX/CBP in ICR Mice After Intravenous Administration of Different Formulations (n = 10)
Figure 14 Acute toxicity study in vivo. Survival curve and body weight of ICR mice after intravenous administration at different doses of (A and D) PTX/CBP, (B and E) Lip-PTX/CBP and (C and F) ES-PEG-Lip-PTX/CBP (n = 10).
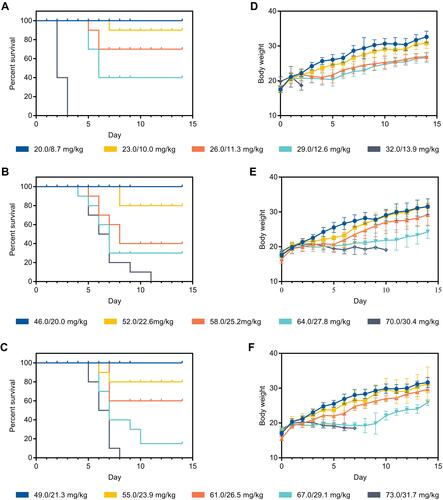
Table 6 Organ Coefficient of Surviving Mice in Low-Dose Group on the 14th Day
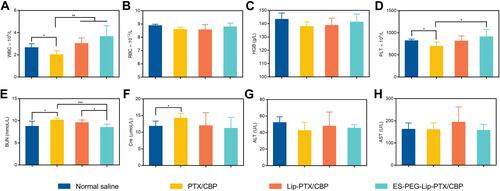
Figure 15 Acute toxicity study in vivo. Blood routine analysis results of (A) WBC, (B) RBC, (C) HGB, and (D) PLT. Biochemical analysis results of (E) BUN, (F) Cre, (G) ALT, and (H) AST. The data were presented as the mean ± SD (n = 10). *p < 0.05, **p < 0.01, ***p < 0.001.