Figures & data
Figure 6 Fluorescent microscopy images of live/dead staining of S. aureus.
Notes: (A) Pristine PDMS, (B) p (DMAEMA+), (C) p (DMAEMA+-co-0.10 MPc), (D) p (DMAEMA+-co-0.25 MPC), and (E) p (DMAEMA+-co-0.50 MPC)-modified PDMS at 24 hours. The green color indicates live bacteria, and the red color indicates dead bacteria, under fluorescence microscopy (the magnification is 10×). (F) Adherence of the live/dead bacteria cell density on the surfaces.
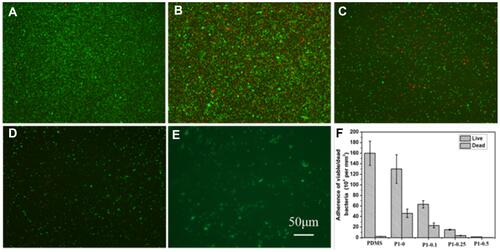
Figure 7 Fluorescent microscopy images of live/dead staining of S. aureus.
Notes: (A) Pristine PDMS, (B) p (DMAEMA+), (C) p (DMAEMA+-co-0.10 MPc), (D) p (DMAEMA+-co-0.25 MPC), and (E) p (DMAEMA+-co-0.50 MPC)-modified PDMS at 72 hours. The green color indicates live bacteria, and the red color indicates dead bacteria, under fluorescence microscopy (the magnification is 10×). (F) Adherence of the live/dead bacteria cell density on the surfaces.
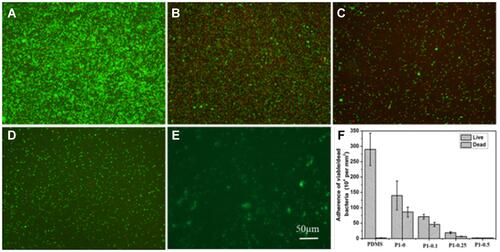
Figure 8 SEM images.
Notes: (A) Pristine PDMS, (B) p (DMAEMA+), (C) p (DMAEMA+-co-0.10 MPc), (D) p (DMAEMA+-co-0.25 MPC), and (E) p (DMAEMA+-co-0.50 MPC)-modified PDMS after exposure to waterborne S. aureus. (F) Adherence of the bacteria cell density on the surfaces.
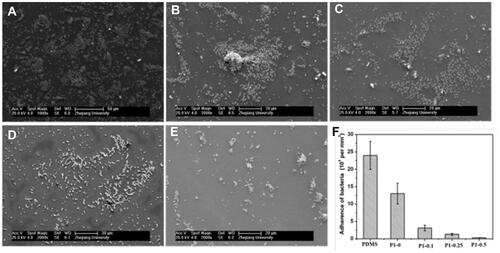
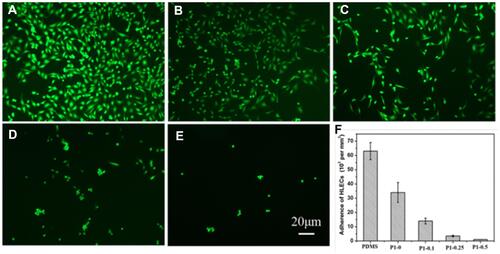
Figure 11 Growth and morphology of HLECs stained with FDA after 24 hours of incubation on various surfaces.
Notes: (A) Pristine PDMS, (B) p (DMAEMA+), (C) p (DMAEMA+-co-0.10 MPc), (D) p (DMAEMA+-co-0.25 MPC), and (E) p (DMAEMA+-co-0.50 MPC)-modified PDMS and (F) adherence of the HLECs density on the surfaces. the magnification is 10×.