Figures & data
Figure 1 Schematic diagram illustrating the preparation of R(L)-CaP/peNOS nanocomplexes based on calcium ion and L-arginine and their intracellular transport in VECs for synergistic NO production.
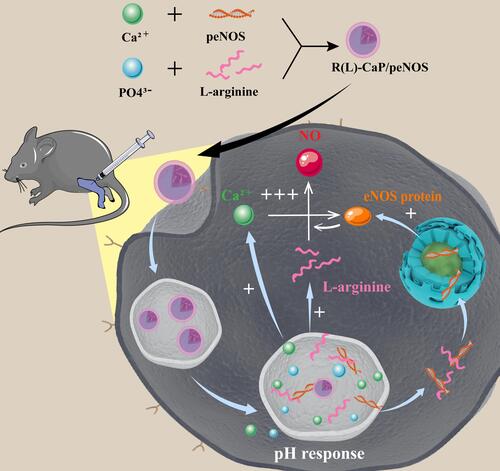
Figure 2 Graphics of agarose gel retardation (A–C) and particle size and zeta potential (D–F) of different gene complexes with weight ratios of CaCl2 and pDNA from 500/1 to 2500/1.
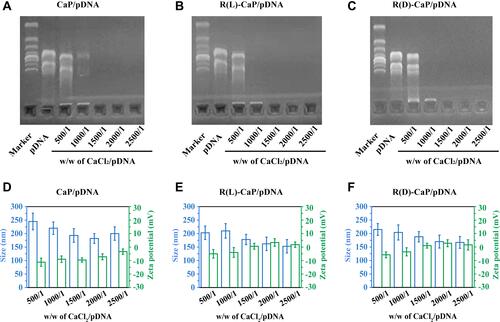
Figure 3 Transfection properties of various gene complexes. (A) The relative cell viability of HUVECs incubated with CaP/pEGFP, R(L)-CaP/pEGFP and R(D)-CaP/pEGFP for 24 h. The results of (B) cellular uptake, (C) mean fluorescence intensities and (D) subcellular location of gene complexes with Cy5 labelled peNOS. The scale bar is 20 μm. (E) The quantitative results of (F) CLR of Cy5-peNOS and LysoTracker Green, (F) CLR of Cy5-peNOS and Hoechst 33342 to reflect the localization rate of target genes in endo/lysosomes and nucleus, respectively. (G) The representative images and (H) quantitative results of transfection efficiency of different gene carriers was evaluated after 24 h of transporting pEGFP. The scale bar is 100 μm. mean ± SD, n = 3, *P <0.05, ***P < 0.001, ###P < 0.001.
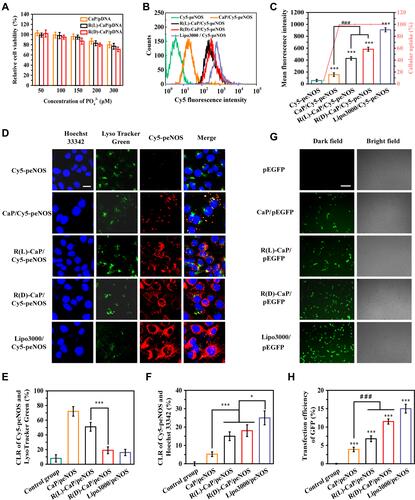
Figure 4 (A) eNOS mRNA and (B) NO levels were detected in HUVECs after treatment with different nanoparticles. (mean ± SD, n = 3, ns means “no statistical difference”. *and #P < 0.05, ##P < 0.01, ***and ###P < 0.001).
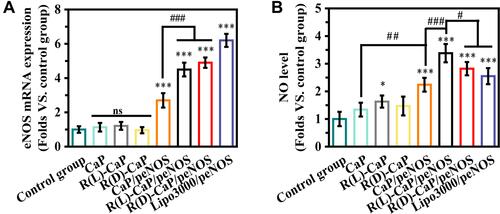
Figure 5 In vitro pro-angiogenic and anti-inflammatory ability of gene complexes. The migration ability of HUVECs treated with various nanocomplexes was evaluated by (A) representative images of migrated cells passing through Transwell chamber, and (C) the statistical results of the number of migrated cells. (B) Representative images of tube formation, and (D) the statistical results of tube number, reflecting the tube formation ability of HUVECs treated with various nanocomplexes. The release of (E) IL-6 and (F) TNF-α in culture media of LPS-unstimulated HUVECs and LPS-stimulated HUVECs after treatment with different gene complexes. The scale bar is 100 μm. mean ± SD, n = 3, #P < 0.05, **and ##P < 0.01, ***and ###P < 0.001.
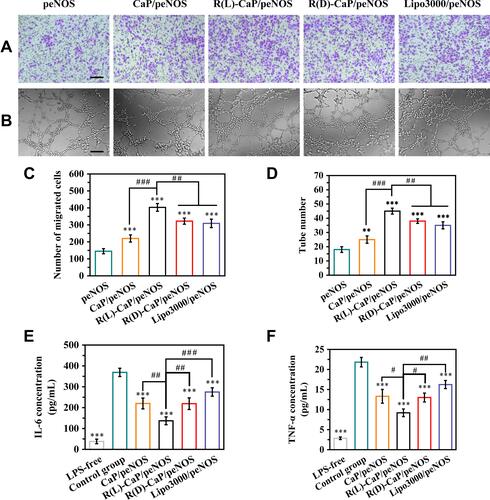
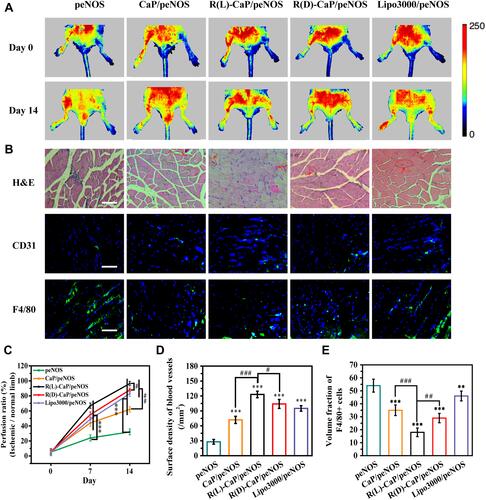
Figure 6 (A) Representative images detected by laser Doppler flowmetry and (C) their statistical results of blood perfusion of hindlimbs treated with different nanocomplexes. (B) Representative images of H&E staining, and investigation of immunofluorescence staining of CD31 and F4/80-positive cells. The scale bar is 100 μm. Statistical results of (D) surface density of blood vessels and (E) inflammatory levels. Mean ± SD, n = 3. #P < 0.05, **and ##P < 0.01, ***and ###P < 0.001.