Figures & data
Figure 1 The structure of CU (A) and CU1 (B).
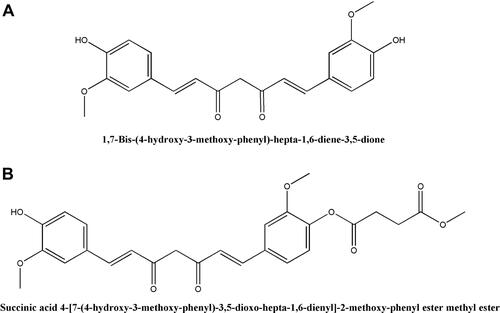
Table 1 The Factors and Levels of Orthogonal Design
Table 2 The Design and Results of Orthogonal Table
Table 3 Variance Analysis Results
Figure 2 The particle size (A) and Zeta potential (B) of optimized CU1-LSLN.
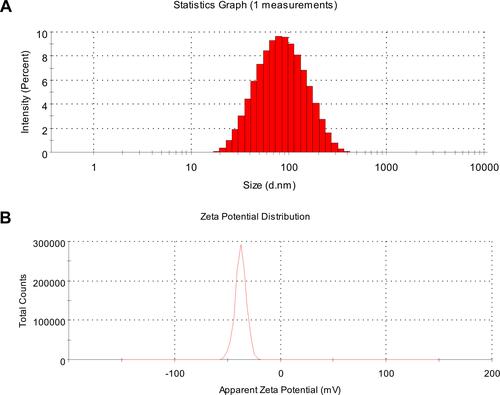
Figure 3 XRD (A), DSC (B), and FTIR (C) patterns.
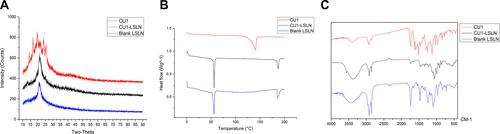
Figure 4 The results of stability test and in vitro release study. (A) The changes of particle size, PDI, DL of CU1-LSLN during the 180 days. (B) In vitro release profile of CU1 and CU1-LSLN.
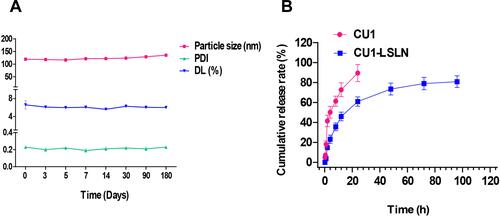
Table 4 Drug Release Kinetic Parameters and Fitting Coefficients
Figure 5 The uptake of CU1-LSLN by MHCC-97H cells. (A) Histogram showing uptake of CU, CU1 and CU1-LSLN by MHCC-97H cells using flow cytometry. (B) The mean fluorescence intensity of MHCC-97H cells after treatment with CU, CU1 and CU1-LSLN for 1 h and 3 h, respectively, *P < 0.05.
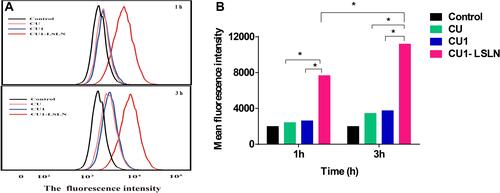
Figure 6 The effects of CU1-LSLN on MHCC-97H cells proliferation compared to CU and CU1. *P < 0.05 vs CU; #P < 0.05 vs CU1.
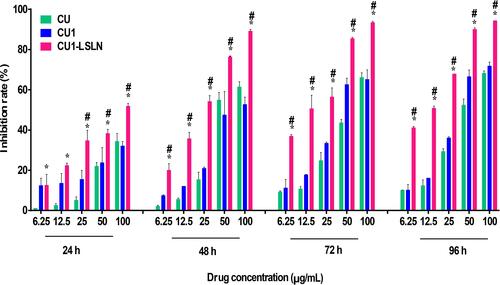
Figure 7 The effect of CU1-LSLN on apoptosis induction. The MHCC-97H cells (2×10⁵ cells/well) were treated with CU, CU1 and CU1-LSLN (5, 10, 20 μmol/L) then were analyzed by Annexin V-PI staining flow cytometry. *P < 0.05 vs CU; #P < 0.05 vs.CU1.
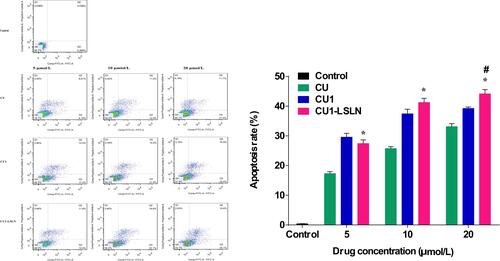
Figure 8 The effect of CU1-LSLN on cell migration and invasion in MHCC-97H cells compared to CU and CU1. (A) Representative images of migration cells stained with crystal violet. Columns, the mean migration rate (%) from three different experiments with three duplicates. (B) Representative images of invasive cells stained with crystal violet. Columns, the mean invasion rate (%) from three different experiments with three duplicates. *P < 0.05 vs CU; #P < 0.05 vs.CU1.
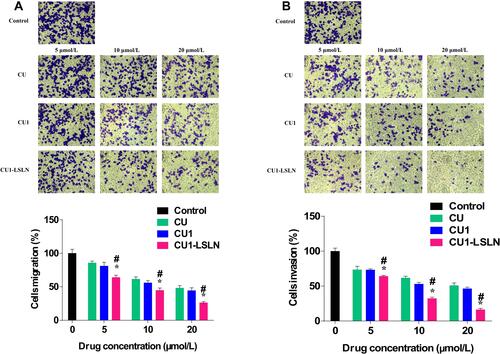
Figure 9 Expression of cells by Western blot (A), and quantitative analysis (B–F). * vs control P < 0.05; ** vs CU P < 0.05.
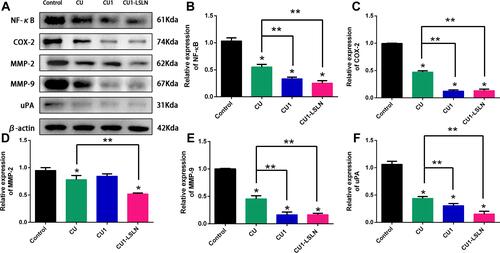
Table 5 The Main Pharmacokinetic Parameters After Given CU, CU1, or CU1-LSLN by Tail Vein Injection
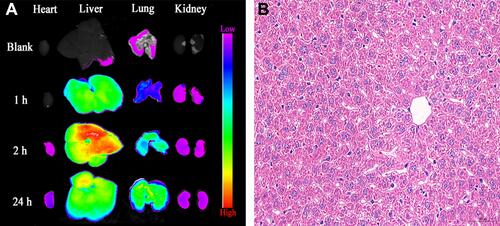
Figure 10 (A) Fluorescence images of organs at 1 h, 2 h, and 24 h after CU1-LSLN was injected into tail vein. (B) H&E staining of liver.