Figures & data
Scheme 1 Schematic illustration of B.bifidum-mediated PFH@CL-Fe3O4 targeted NPs for HIFU ablation and US/MR imaging.
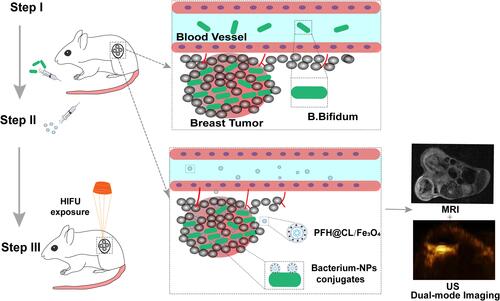
Figure 1 Synthesis and characterization of PFH@CL/Fe3O4 NPs and B.Bifidum. (A) Synthetic procedures for PFH@CL/Fe3O4 NPs via thin film hydration method. (B) Optical microscope image of PFH@CL/Fe3O4 NPs (400 × magnification), the scale bar is 20 µm. (C) TEM images of PFH@CL/Fe3O4 NPs. (D) Optical microscope image of Gram stain of B.Bifidum (400 × magnification), the scale bar is 20 µm. (E) Surface zeta potential of PFH@CL/Fe3O4 NPs. (F) Surface zeta potential of B.Bifidum. (G) Particle size distribution of PFH@CL/Fe3O4 NPs. (H) The particle size PFH@CL/Fe3O4 NPs over a period of 9 days in deionized water. (I) The zeta potential of NPs over a period of 9 days in deionized water.
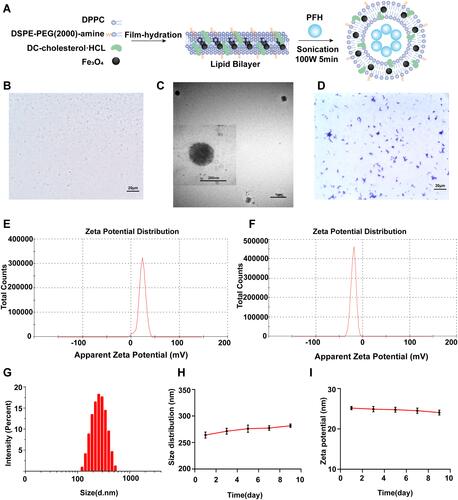
Figure 2 In vitro construction of the biological targeting magnetic NPs. (A) CLSM images of DiI-labeled cationic and non-cationic NPs (red) and FITC-labeled B.Bifidum (green). Compared with the non-targeted group, there was a significantly stronger red fluorescent signal on the surface of B.Bifidum in the targeted group, the scale bar is 100 µm. (B) FCM image of binding efficiencies of PFH@CL/Fe3O4 NPs and B.Bifidum.
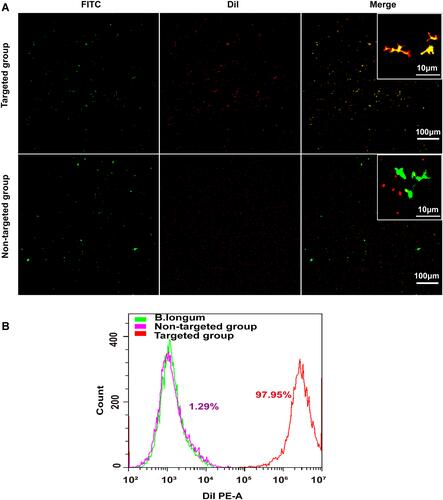
Figure 3 In vivo targeting behaviors of biological targeting magnetic NPs. (A) Homogenates of tumor tissues and normal organs were cultured on solid BL agar. (B) In vivo targeting efficiency before and after PFH@CL/Fe3O4 NPs with intravenous administration. Fluorescence intensity of tumor-bearing mice at pre-injection and 6h, 24h, 30h, 48h post-injection of targeted group and non-targeted group. (C) The corresponding in vivo quantitative fluorescence intensity of tumor. The fluorescence intensity in targeted group was slightly higher than that in non-targeted group 6h after injection of NPs (**p < 0.01). The fluorescence intensity in targeted group was significantly higher than that in non-targeted group 30h after injection of NPs (***p < 0.001). (D) In vitro fluorescence intensity of the major organs (heart, liver, spleen, lung and kidney) and tumors 48h after injection of targeted group and non-targeted group. (E) The corresponding in vitro quantitative fluorescence intensity of major organs and tumors. The fluorescence intensity of tumor in targeted group was significantly higher than that in non-targeted group (***p < 0.001).
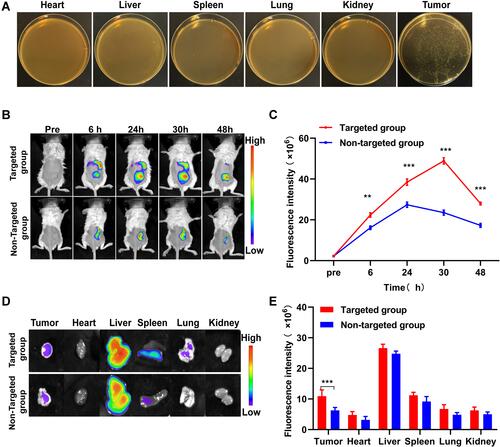
Figure 4 The phase transition of biological targeting NPs and contrast-enhanced ultrasound imaging both in vitro and in vivo. (A) Optical microscope image of PFH@CL/Fe3O4 NPs before and after HIFU irradiation (400 ×magnification). After irradiation, the NPs became larger and fused into microbubble, the scale bar is 20 µm. (B) In vitro ultrasound images of PFH@CL-Fe3O4, PFH-CL, Fe3O4-CL, PBS before and after HIFU irradiation. (C) The gray value of in vitro CEUS before and after HIFU irradiation (n = 3). The gray value of PFH@CL-Fe3O4 was significantly higher than those of other groups after HIFU irradiation (***p < 0.001). (D) In vivo B-mode and CEUS images of B.Bifidum + PFH@CL-Fe3O4, PFH@CL-Fe3O4, B.Bifidum and PBS before and after HIFU irradiation. (E) The gray value of in vivo CEUS before and after HIFU irradiation (n=3). The CEUS gray value of B.Bifidum group after HIFU ablation was slightly higher than that before HIFU ablation (*p < 0.05), and the CEUS gray value of B.Bifidum + PFH@CL-Fe3O4 group and PFH@CL-Fe3O4 group after HIFU ablation was significantly higher than that before ablation (***p < 0.001). After HIFU ablation, the CEUS gray value of B.Bifidum + PFH@CL-Fe3O4 group was significantly higher than that of the other three groups (***p < 0.001).
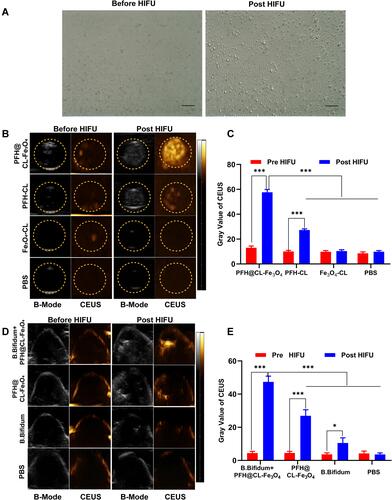
Figure 5 MRI assessment of PFH@CL/Fe3O4 NPs in vitro and in vivo. (A) The curve of 1/T2 versus PFH@CL/Fe3O4 NPs at elevated Fe3O4 concentration. Inset: T2-weighted MR intensities of PFH@CL/Fe3O4 NPs at different Fe3O4 concentration (n = 3). (B) Image of 4T1 tumor-bearing mice (region enveloped by the red dotted line) at pre, 6h, 24h, 30h and 48h post-injection of targeted NPs and non-targeted NPs. (C) Quantitative analysis of SIdec (n = 3), the difference was detected in the targeted group and non-targeted group (*p < 0.05, **p < 0.01, ***p < 0.001).
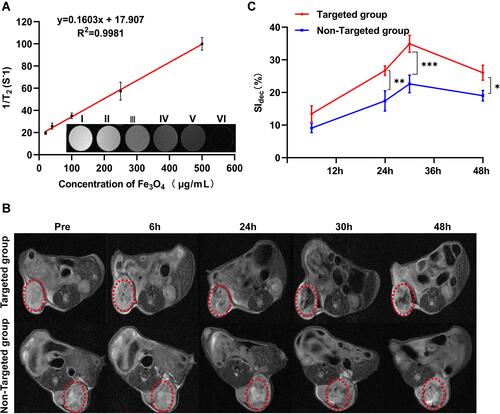
Figure 6 Synergistic HIFU treatment of PFH@CL/Fe3O4 NPs. (A) In vivo US imaging of tumor tissues (yellow circle) before and after HIFU irradiation in different group. The yellow dotted circle marks the tumor nodules. (B) The comparison of gray values of tumor tissues in each group after HIFU irradiation. The mean grayscale difference in the B.Bifidum + PFH@CL/Fe3O4 NPs group was significantly higher than the other groups (n = 3, *** p < 0.001). (C) Coagulative necrosis of tumors by TTC staining after HIFU therapy, the necrosis tissue appears grayish white (black arrow) and the normal tumor tissue is red. (D) The comparison of coagulative necrosis of tumor tissues in each group after HIFU irradiation. The coagulative necrosis volume of the B.Bifidum + PFH@CL/Fe3O4 NPs group was significantly bigger than any other groups (n = 3, ***p < 0.001). (E) The comparison of EEF of tumor tissues in each group after HIFU irradiation. The results showed that the B.Bifidum + PFH@CL/Fe3O4 NPs group was significantly lower than any other groups (n = 3, *** p < 0.001). (F) Optical microscope images of tumor sections from each group after HIFU ablation were stained for HE staining, TUNEL assay. There exists a significant boundary between the nonablated and ablated region in HE staining (200 × magnification), the scale bar is 20 μm. TUNEL positive cells are in brown and increased in the coagulation necrosis region (400 × magnification), the scale bar is 10μm.
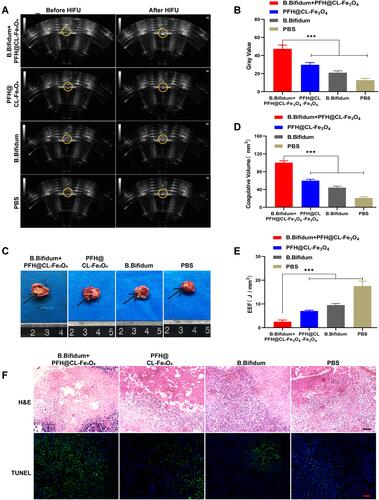
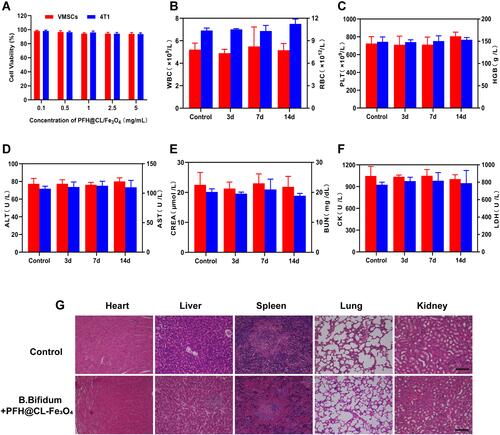
Figure 7 Biosafety assay. (A) Cell viability assay of different concentration PFH@CL/Fe3O4 NPs incubated with 4T1 breast tumor cells and VMSCs normal cells. (B–F) Hematological assay of BALB/c mice of control group and the experimental groups at the corresponding time point. (G) H&E staining in major organs (heart, liver, spleen, lung, and kidney) of control group and the experimental groups after HIFU ablation (H&E: ×200 magnification), the scale bar is 20 μm.