Figures & data
Figure 1 Identity, transfection and spherification of hUC-MSCs. (A) Representative images (100×) of adipogenesis (i), osteogenesis (ii), and chondrogenesis (iii) of hUC-MSCs stained with oil red O, alizarin red S, and Alcian blue, respectively. (B) Transfection and spherification of hUC-MSCs were performed. hUC-MSCs (GFP) (ii) were obtained by transfecting lentiviruses with GFP into hUC-MSCs (i). hUC-MSCsp (iii), and hUC-MSCsp (GFP) (iv and v) were observed by inverted fluorescent microscopy and confocal laser scanning microscopy, respectively. (C) Surface markers of hUC-MSCs, including isotype-control IgG negative, CD31 negative, CD45 negative, CD90 positive, and CD105 positive cells, were detected by flow analysis. (D) The proliferation ability of the hUC-MSCs group and hUC-MSCs (GFP) groups was detected by CCK-8 at 1 week. (E and F) Apoptosis of hUC-MSCs, hUC-MSCs, and hUC-MSCs (GFP) groups was detected by flow analysis (annexin V-APC and 7-AAD).
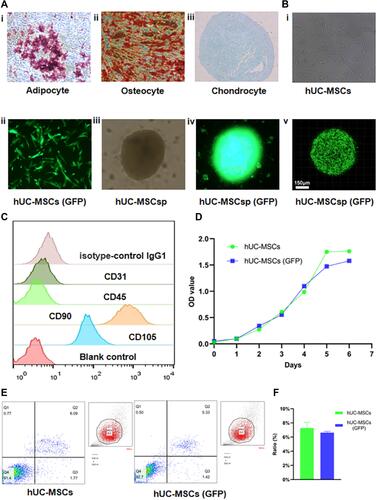
Figure 2 Characteristics of peptide hydrogel and co-culture with hUC-MSCs. (A) Microstructure of peptide hydrogel including RADA16-I (i), RGD (ii), KLT (iii), and mixed peptide hydrogel (iv) were observed by atomic force microscopy. (B) Macrostructure of a self-assembled mixed peptide hydrogel using a transwell chamber (Corning 7007). Scale bar: 10 mm (i) Microstructure of a mixed peptide hydrogel was observed using scanning electron microscopy. Scale bar: 10 μm (ii) and 1 μm (iii). (C and D) The elemental composition of the mixed peptide hydrogel and their percentages were obtained by mapping analysis. (E) The state of the mixed peptide hydrogel co-cultured with hUC-MSCs in hUC-MSCs and hUC-MSCs+hydrogel groups was examined by AO/EB staining after 24, 48, and 72h. (F) The concentration of VEGF in the total protein and supernatant after co-culture of hUC-MSCs with or without mixed peptide hydrogels was measured with a VEGF kit. Scale bar: 100 µm. *p<0.05, ***p<0.001.
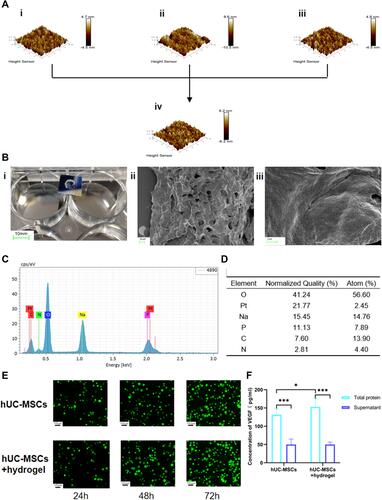
Figure 3 Mechanical properties of peptide hydrogels. Rheological analysis of peptide hydrogels. Storage modulus (G’) and loss modulus (G”) of four peptide solutions. (A) RADA16-I, (B) RGD, (C) KLT, and (D) RADA16-I+RGD+KLT. (E) Circular dichroism analysis of the structure of four peptide solutions.
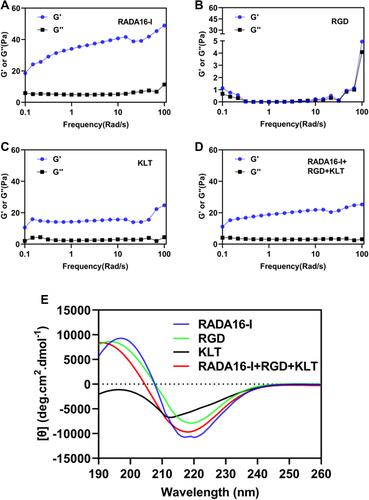
Figure 4 Wound healing behaviors with different treatments. (A) Representative photo micrographs of wounds when treated with different treatments administered for various durations. The inner diameter of initial wound was 8 mm. (B) Hematoxylin and eosin (H&E) stained images of wounds with different treatments after 3, 7, 10, and 14 days. Green arrow: follicle hair, black arrow: scab, red arrow: red vessel, blue arrow: epidermis, and orange arrow: granulation tissue. Scale bar: 200 µm.
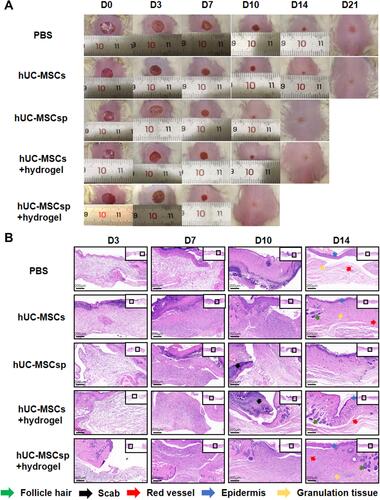
Figure 5 Immunohistochemical analysis of GFP and angiogenesis. (A) Representative images of GFP immunohistochemical staining of each group at 3, 7, 10, and 14 days after surgery. Scale bar: 200µm. (B) Representative images of CD31 immunohistochemical staining of each group at 3, 7, 10, and 14 days after surgery. Scale bar: 200µm.
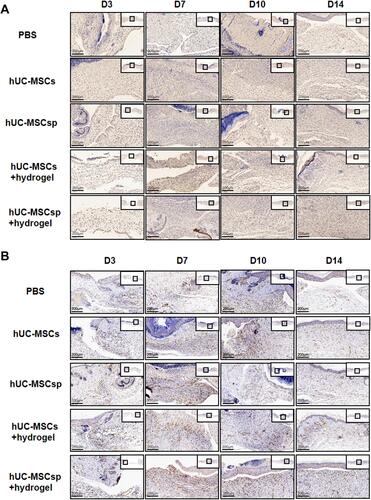
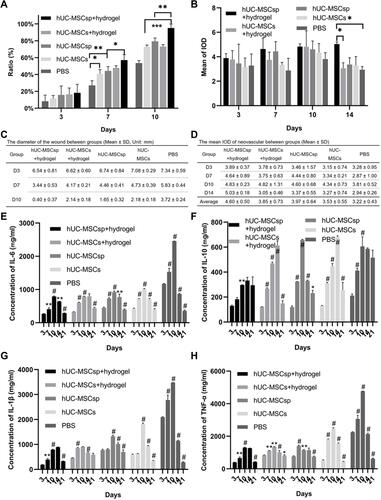
Figure 6 Quantitative analysis of different indexes of each group. (A) Quantification of wound healing rates of each group. (B) Quantitative analysis of the mean of IOD of each region in each group after 3, 7, 10, and 14 days. (C) Comparison of the diameters of wounds between groups. (D) The mean IOD of neovascularization between groups. Quantification of (E) IL-6, (F) IL-10, (G) IL-1β, and (H) TNF-α concentrations in each group. Data are presented as the mean ± SD and error bars indicate the SD. P-values were calculated using two-way ANOVA with Tukey’s multiple comparison tests. *p<0.05, **p<0.01, ***p<0.001 or #when p<0.001, #indicated it was statistically significant compared with prior data within groups.