Figures & data
Figure 1 Rats’ dorsal skin photographs of (A) normal control group (unexposed to UVB-irradiation) and (B) positive control group (exposed to UVB-irradiation, where skin alterations were visible, as the skin was erythematous and wrinkled, as well as, being hyperpigmented in certain areas).
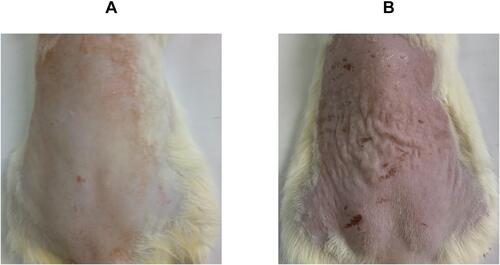
Table 1 The Composition of the Experimental Runs According to the D-Optimal Statistical Design and Their Responses
Figure 2 Pseudo-ternary diagram of vitamin E and safflower oil (1:3), Span 80/kolliphor EL/ Arlasolve (1:1:1), and water. The defined percentages of the oils (20–45%), the surfactant/ cosurfactant (S/Cos) (45–70%), and water (10–25%) are represented by the black triangle.
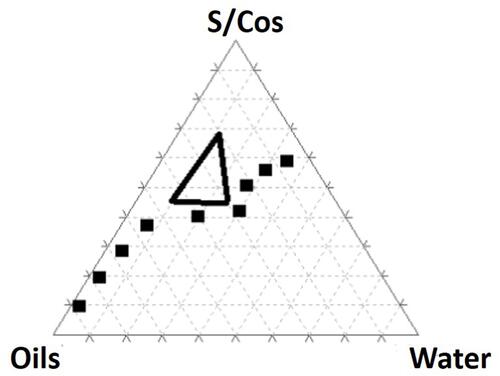
Table 2 Summary of Model Statistics for the Measured Responses
Figure 3 3D surface plots demonstrating the effect of the independent variables; the percentage of oils (A), the percentage of S/Cos (B), and the percentage of water (C) on (I) globule size in nm (GS), (II) Polydispersity index (PDI), (III) Percent transmittance (%), and (IV) Viscosity in cp.
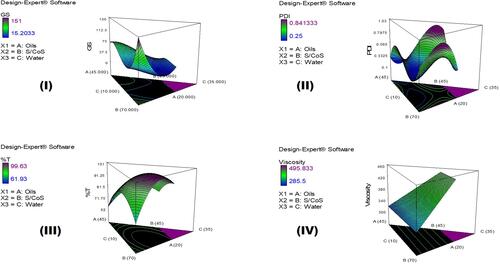
Table 3 The Observed and the Predicted Values of the Optimized Collagen-Loaded NE
Figure 4 TEM micrographs of (A) collagen-loaded NE, and (B) Vit C-loaded NE.
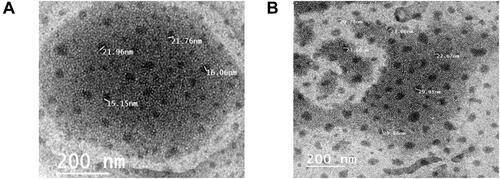
Table 4 Characteristics of the Optimized Collagen-Loaded NE and Vit C-Loaded NE Before and After Storage at (25±2 °C/60±5% RH) for 6 Months
Figure 5 Surviving fraction after applying the different treatments (Vit E, Vit C, collagen, plain NE lacking Vit E, Plain NE, Vit C-loaded NE, collagen-loaded NE, and a mixture of collagen and Vit C-loaded NEs) for 48 h on (A) HFB4 cells, (B) BHK cells, (C) HFB4 cells after applying the treatments at the highest concentration (50 µL/mL), and (D) BHK cells after applying the treatments at the highest concentration (50 µL/mL). The actual data represent the mean ± SD of three separate experiments performed in duplicates. Results were analyzed for statistical significance by one-way analysis of variance (ANOVA) followed by Tukey multiple comparison post-hoc test. aSignificant difference from Vit E, bSignificant difference from Vit C, cSignificant difference from collagen, dSignificant difference from Plain NE lacking Vit E, eSignificant difference from Plain NE, fSignificant difference from Vit C-loaded NE, and gSignificant difference from collagen-loaded NE (p<0.05).
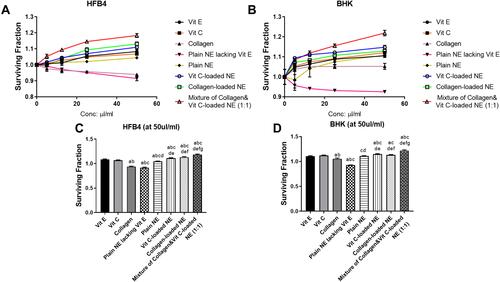
Figure 6 Micrographs of the stained healed monolayer of HFB4 and BHK cells. (A) Control at 0 h, (B) control after 48 h, (C) Vit E, (D) Vit C, (E) collagen, (F) plain NE lacking Vit E, (G) plain NE, (H) Vit C-loaded NE, (I) collagen-loaded NE, and (J) A mixture of collagen- and Vit C-loaded NEs.
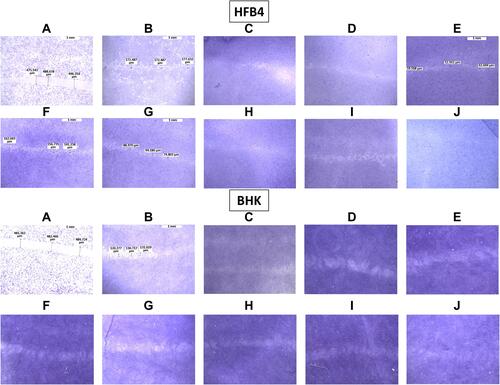
Figure 7 CLSM micrographs of (A) Rhodamine B dye aqueous solution and (B) Rhodamine B dye-loaded NE.
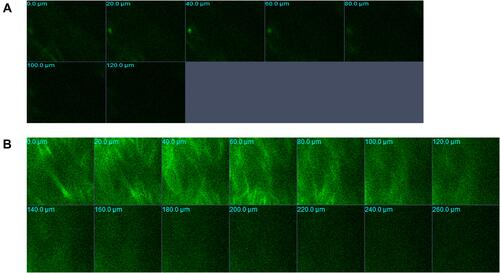
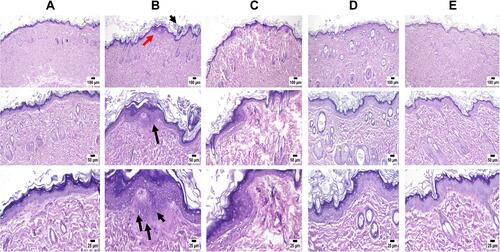
Figure 8 Microscopic examination of skin samples from (A) control group revealing normal histology of skin, (B) positive control showing histopathological alterations mainly in the epidermis. Hyperkeratosis and acanthosis (black arrows) are manifested by thickening in the epidermal layer (red arrow). The epidermis contained numerous shrunken cells known as sunburn cells near the basal cell layer (3 black arrows), (C) Vit C-loaded NE showing apparently normal skin with mild inflammatory cells infiltration, (D) collagen-loaded NE showing apparently normal skin, and (E) a mixture of collagen and Vit C-loaded NEs revealing skin free from any detectable alterations.