Figures & data
Figure 1 Characterization of the obtained MSNs and Rhodamine B-functionalized MSNs. (A) Representative transmission electron microscopic image of amino-functionalized MSNs. Scale bar: 500 µm (B). Size distribution of the amino-functionalized MSNs was determined based on TEM image analysis. The particles on TEM images were measured and their diameter was illustrated on this graph. (C) Using dynamic light scattering the average size of amino-functionalized (MSN) and Rhodamine B-functionalized MSNs (RhoB@MSN) was measured via the determination of hydrodynamic diameter of the particles (D). FT-IR spectra of amino-functionalized MSNs (MSN), Rhodamine B (RhoB) and of Rhodamine B-functionalized MSNs (RhoB@MSN) (E). Histograms representing the Rhodamine B fluorescence intensity upon Rhodamine B treatment of MCF-7 and MCF-7 KCR cells and of Verapamil-treated MCF-7 KCR cells (F). Histograms representing the Rhodamine 123 fluorescence intensity of Rhodamine 123-exposed MCF-7 and MCF-7 KCR cells and of Verapamil-treated MCF-7 KCR cells.
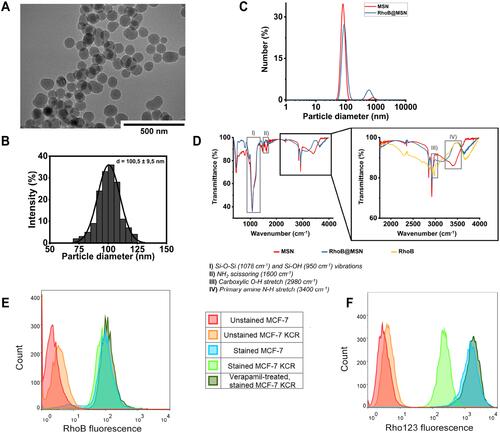
Figure 2 Accumulation of RhoB@MSNs in drug-sensitive and multidrug-resistant cancer cells (A). Viability of MCF-7 and MCF-7 KCR cells after RhoB@MSN treatments compared to the untreated control samples (B). Rhodamine B fluorescence intensity of MCF-7 and MCF-7 KCR cells following 24-hour RhoB@MSN exposure. Two-way ANOVA Sidak’s multiple comparisons test, *P<0.05; **P<0.01; #P<0.0001 (C). Representative histograms obtained by flow cytometry analysis of PKH67-labeled untreated and RhoB@MSN-treated MCF-7 cells (D). Histograms representing the internalized Rho@MSNs in RhoB@MSN-treated and control MCF-7 KCR cells (E). Relative amount of internalized RhoB@MSNs within RhoB-positive cells. Unpaired t-test.
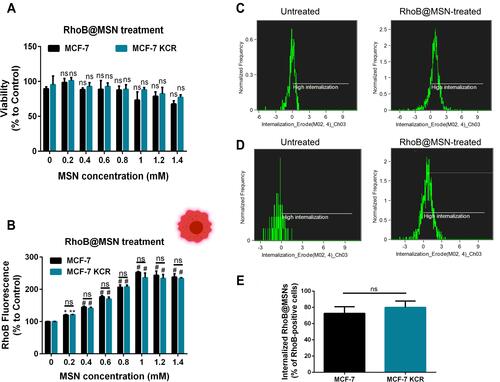
Figure 3 Subcellular localization of the internalized RhoB@MSNs (A). Representative images of RhoB@MSN-treated MCF-7 cells after MitoTracker as well as LysoTracker staining, respectively. Scale bar: 20 µm (B). Representative pictures of RhoB@MSN-exposed MCF-7 KCR cells after Mito-, and LysoTracker staining. Scale bar: 20 µm (C). Quantification of RhoB-positive MCF-7 and MCF-7 KCR cells based on microscopic images. Unpaired t-test (D). The percentage of RhoB@MSNs that co-localized with lysosomes, according to the fluorescent microscopic images. Unpaired t-test, Mann–Whitney test, ****P<0.0001.
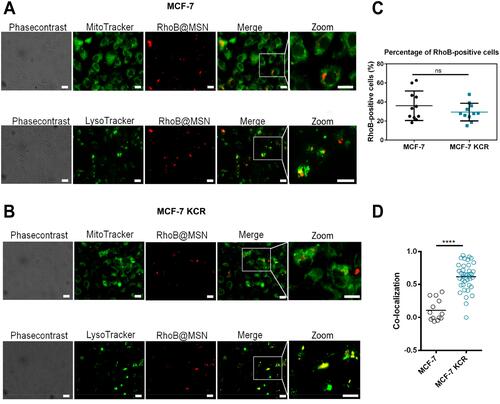
Figure 4 Time-dependent dynamics of the intracellular fluorescence intensity of Rhodamine B in RhoB@MSN-treated MCF-7 and MCF-7 KCR cells (A). Representative histograms obtained by flow cytometric analysis of MCF-7 cells after 24-hour RhoB@MSN treatment and 24 or 48 hours after the removal of RhoB@MSN-containing media (B). Representative histograms of untreated, 24 h RhoB@MSN-treated MCF-7 KCR cells and of MCF-7 KCR cells 24 or 48 hours after the removal the RhoB@MSN treatments (C). Graph and Table representing the percentage of RhoB-positive MCF-7 and MCF-7 KCR cells after 0, 24 and 48 hours from the removal of RhoB@MSNs. Two-way ANOVA Sidak’s multiple comparisons test, ****P<0.0001.
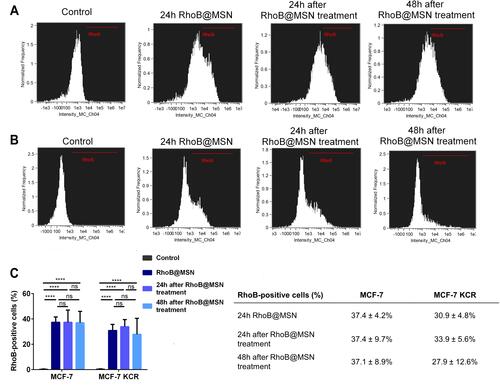
Figure 5 The efficiency of MSN-based drug-delivery of the fluorescent cargo Rhodamine 123 (A). Intracellular Rho123 fluorescence intensity of MCF-7 and MCF-7 KCR cells treated with the free form of Rho123. Two-way ANOVA Sidak’s multiple comparisons test, **P<0.01; ****P<0.0001 (B). Viability of MCF-7 and MCF-7 KCR cells after RhoB@Rho123@MSN exposures compared to the untreated cells (C). Rhodamine B fluorescence intensity of MCF-7 and MCF-7 KCR cells after RhoB@Rho123@MSN treatments (D). The measured Rhodamine 123 fluorescence intensity after RhoB@Rho123@MSN exposure of MCF-7 and MCF7 KCR cells. Two-way ANOVA Sidak’s multiple comparisons test, ****P<0.0001.
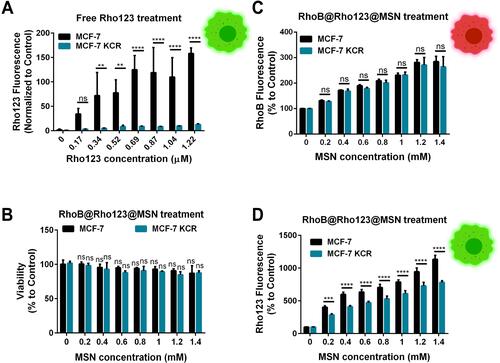
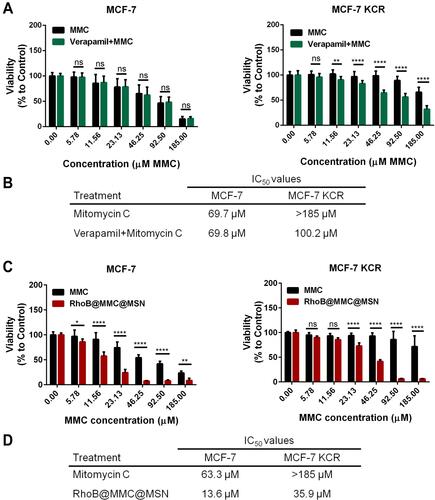
Figure 6 The efficiency of MSN-based delivery of the anticancer agent Mitomycin C as a cargo (A). Viability of MCF-7 and MCF-7 KCR cells after Mitomycin C or Mitomycin C + Verapamil treatments. Two-way ANOVA Sidak’s multiple comparisons test, **P<0.005; ****P<0.0001 (B). IC50 values calculated from the viability results of Mitomycin C-, or Mitomycin C + Verapamil-treated MCF-7 and MCF-7 KCR cells (C). Viability of MCF-7 and MCF-7 KCR cells upon MMC or RhoB@MMC@MSN treatments. Two-way ANOVA Sidak’s multiple comparisons test, *P<0.05; **P<0.005; ****P<0.0001 (D). IC50 values determined from the viability results of MCF-7 and MCF-7 KCR cells after MMC or RhoB@MMC@MSN treatment.